




Read
The Bakken at Twenty: What the Boom Built, and What It Broke
Twenty summers after the boom started, we put numbers to what oil built in western North Dakota and what it's still breaking.
Every dispatch is also a podcast. Follow on Spotify ↗
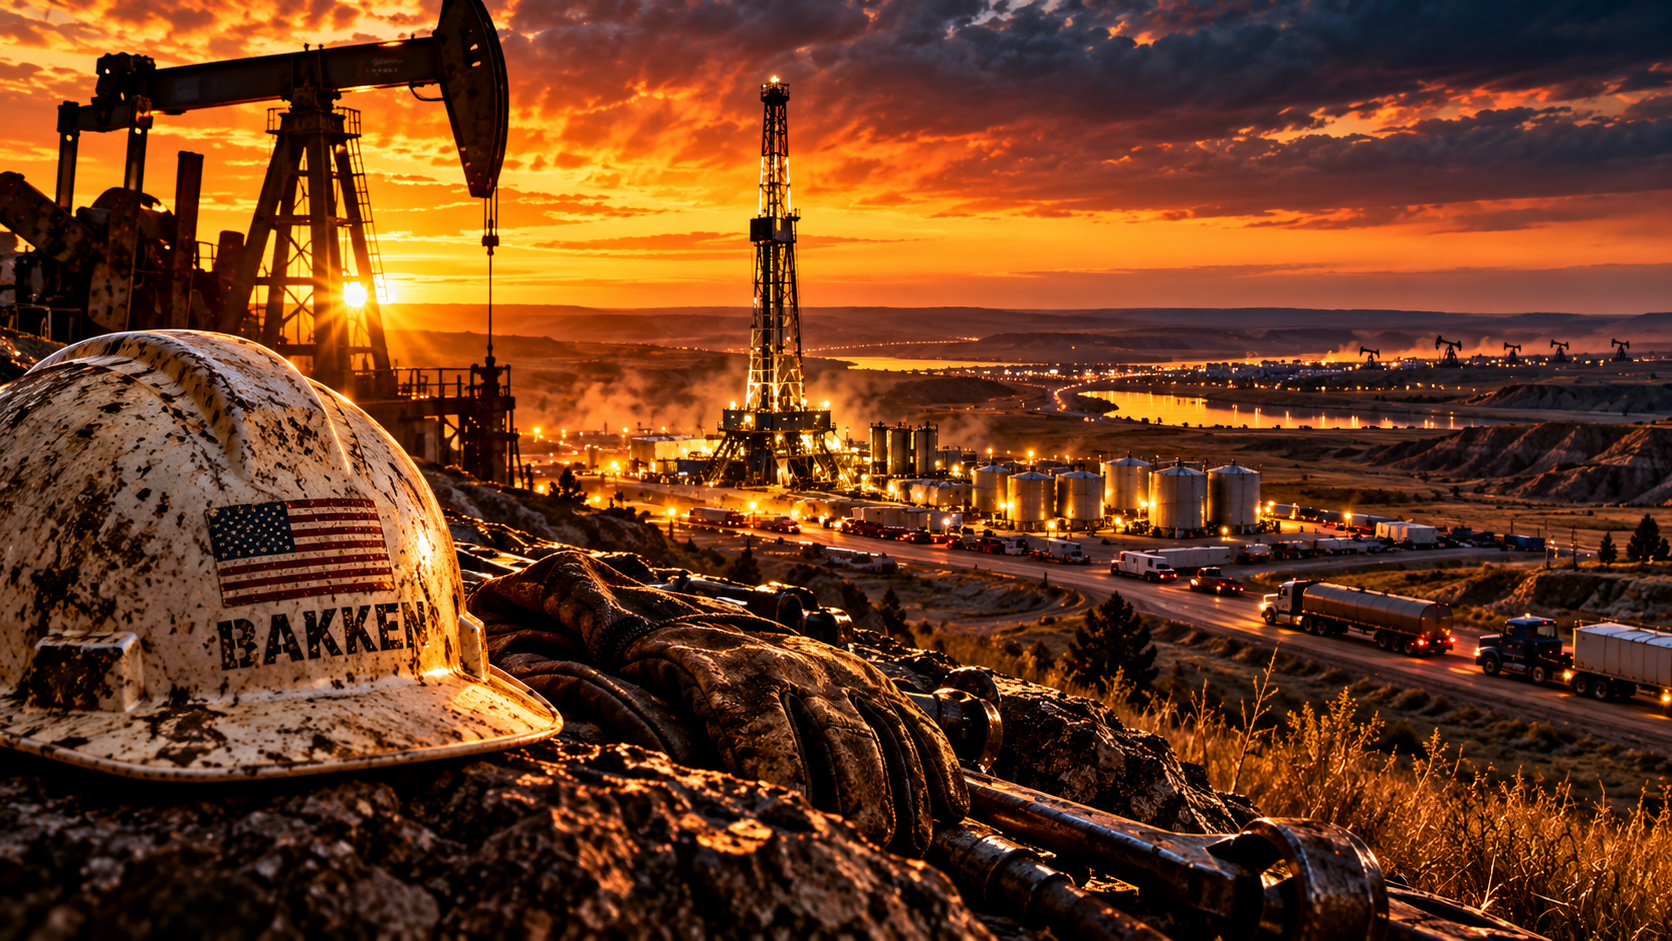
It's been about twenty summers since the Bakken boom got going. The Parshall field was found in 2006, and within a few years the whole western half of the state felt it.
Rent that cost more than New York.Help that left for the rigs. Gravel roads that are washboard two days after the grader goes by. Grain sitting on the ground while oil trains rolled past. And a running argument about where all that tax money actually went.
This piece puts numbers to those stories. Some of them turn out to be even bigger than the gossip. A few are more complicated. All of it is current as of October 1, 2026.
The oil: from a sideline to a million barrels a day
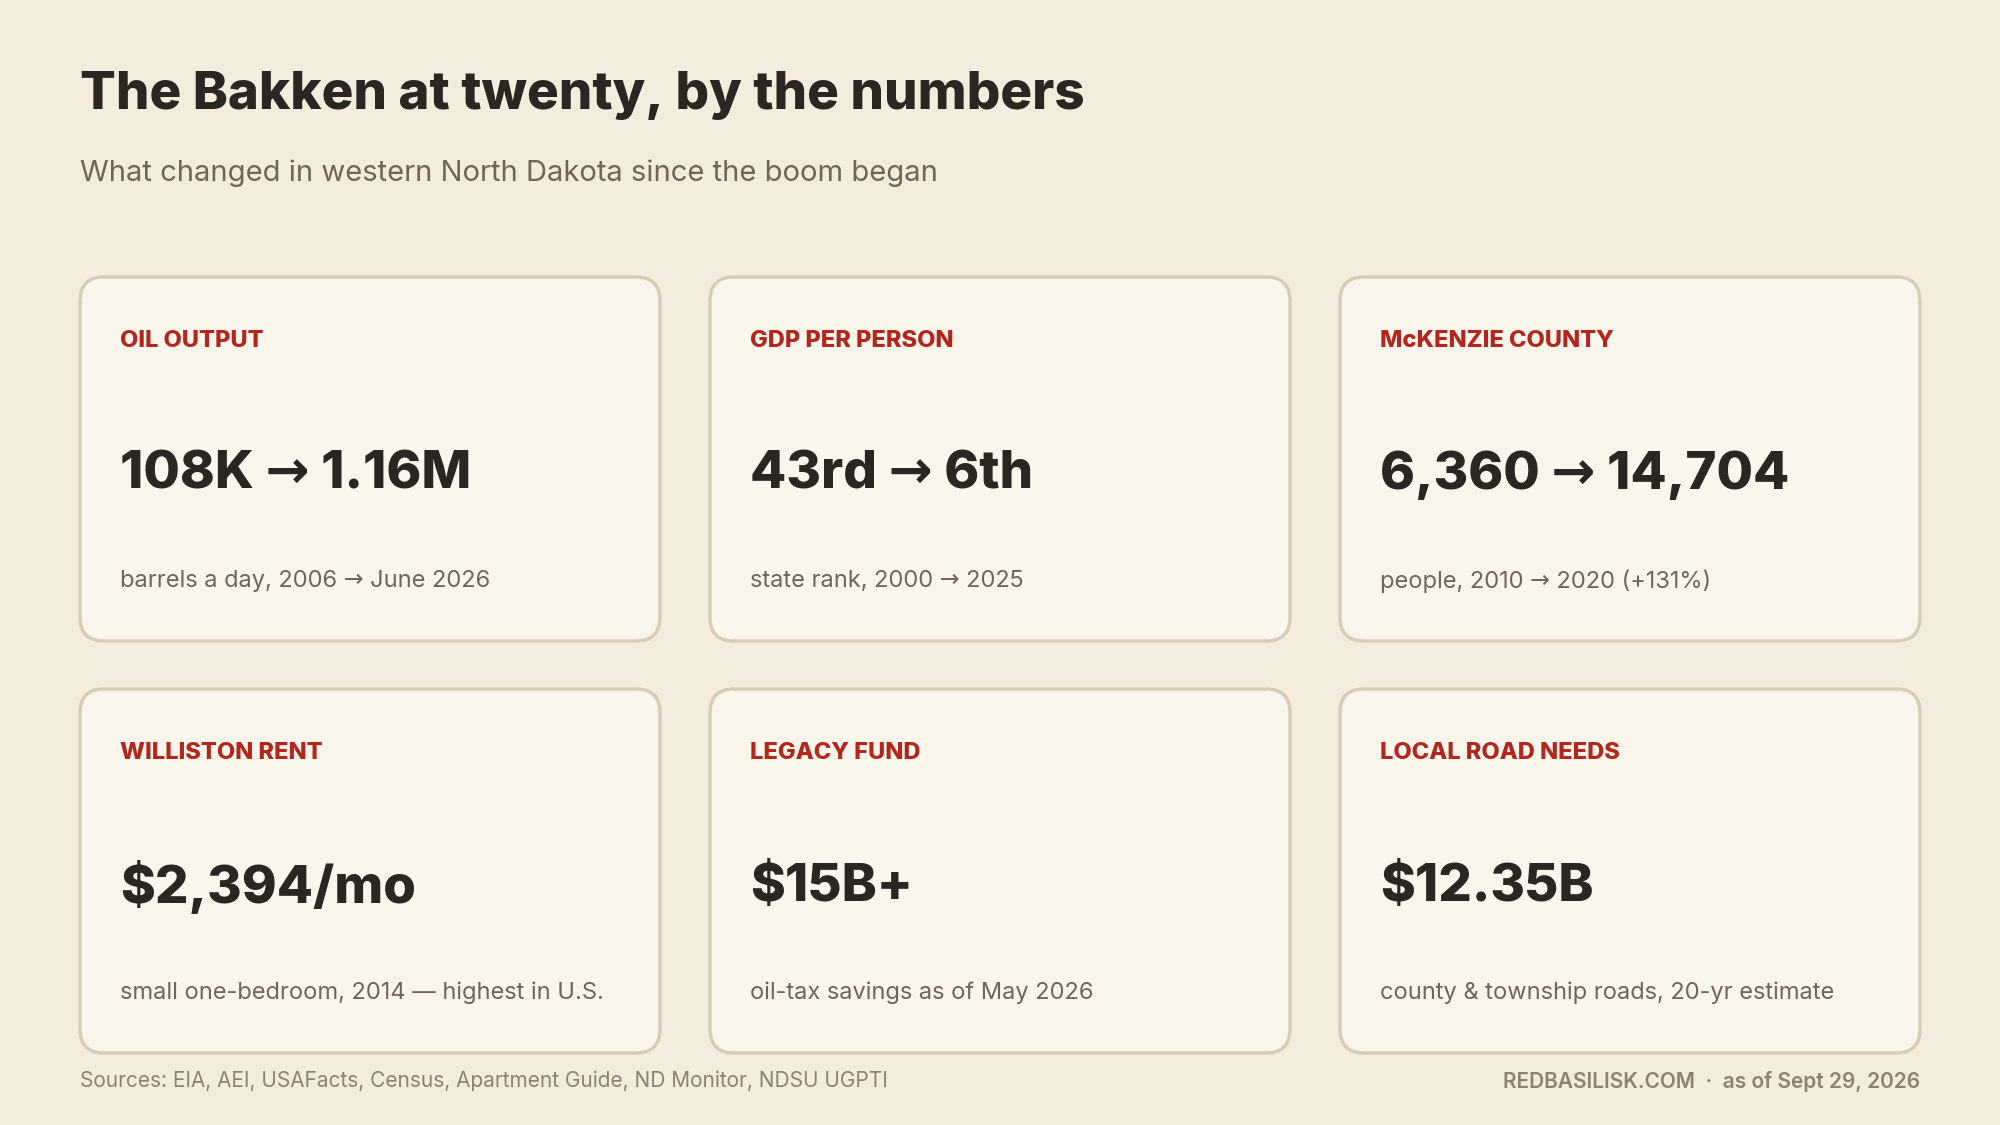
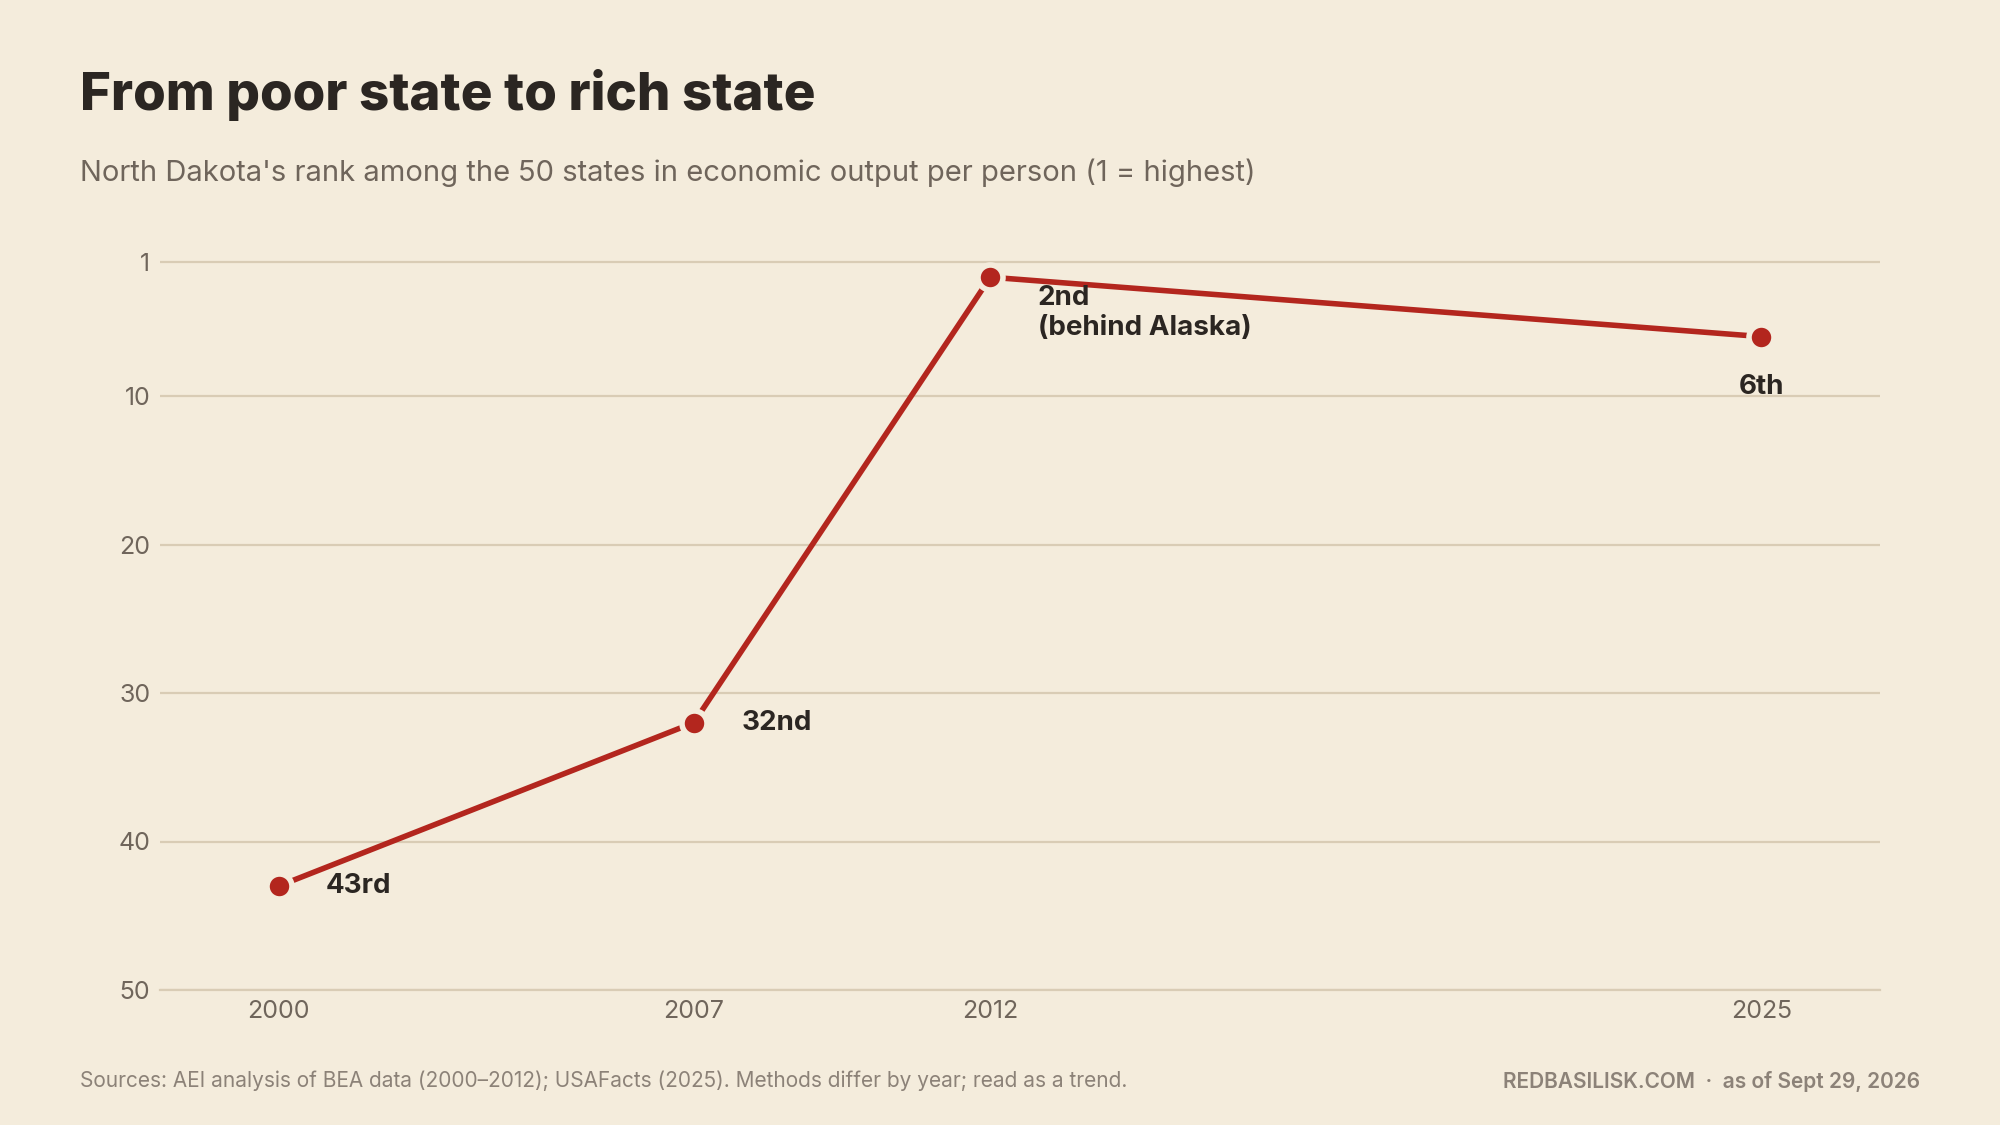
In 2006, North Dakota averaged about 108,000 barrels of oil a day. That was a respectable sideline, not a boom.
Then horizontal drilling and fracking cracked the Bakken open. The state passed 100 drilling rigs in the spring of 2010 and broke its old 1981 record of 148 that fall. The count peaked at 218 rigs on May 29, 2012.
Production followed. North Dakota crossed a million barrels a day in the spring of 2014. That's roughly ten times where it started.
Then prices crashed. By February 2016 the rig count had fallen to 44, and it bottomed out at about 25 that May. Nonfarm employment in Williams County dropped about 38 percent between January 2015 and March 2016.
The boom came back anyway. Production hit its all-time high of about 1.5 million barrels a day in November 2019, took a hard hit during COVID, and has averaged roughly 1.1 to 1.2 million a year since. In June 2026 the state averaged about 1.16 million barrels a day.
What's different now is how it gets done. There were only 27 rigs running at the end of 2025, down from 37 a year before, and output barely moved. Companies are drilling longer laterals and getting more oil out of each well.
The money: a poor state gets rich
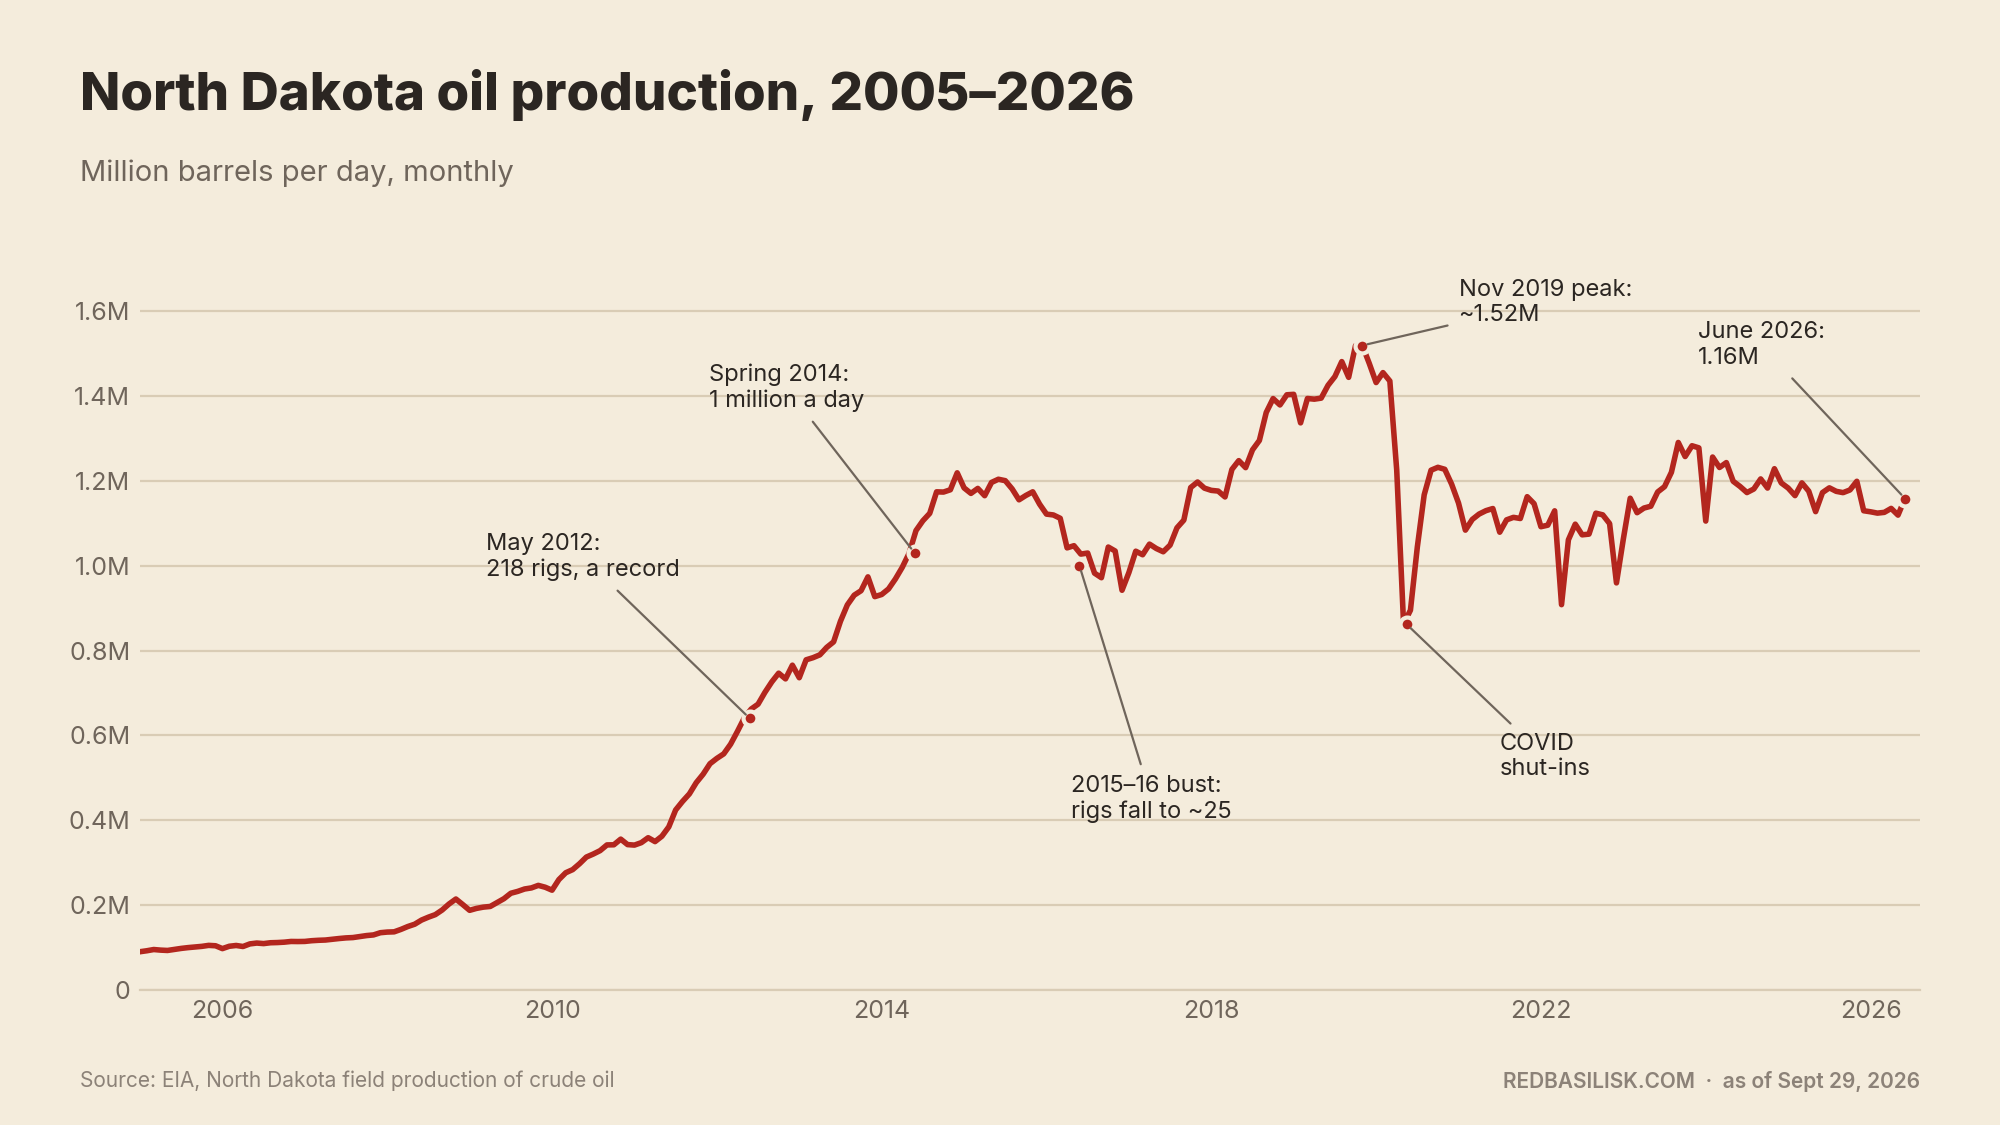
It's easy to forget how poor North Dakota looked on paper before the boom. In 2000, the state ranked 43rd in the country for economic output per person. By 2007 it had climbed to 32nd.
By 2012 it was second, behind only Alaska. In 2025 it ranked sixth, and mining and oil-and-gas extraction was the single biggest industry in the state, contributing about $10.9 billion to its economy.
The tax side is just as big. Oil extraction and production taxes brought in more than $32 billion between 2008 and 2024, according to a study by an oil industry foundation and the oil-county association. Over recent years, oil taxes have made up more than half of all the taxes the state collects.
Thirty percent of every oil tax dollar goes into the Legacy Fund, which voters created in 2010. The fund passed $10.5 billion in 2024 and topped $15 billion by May 2026.
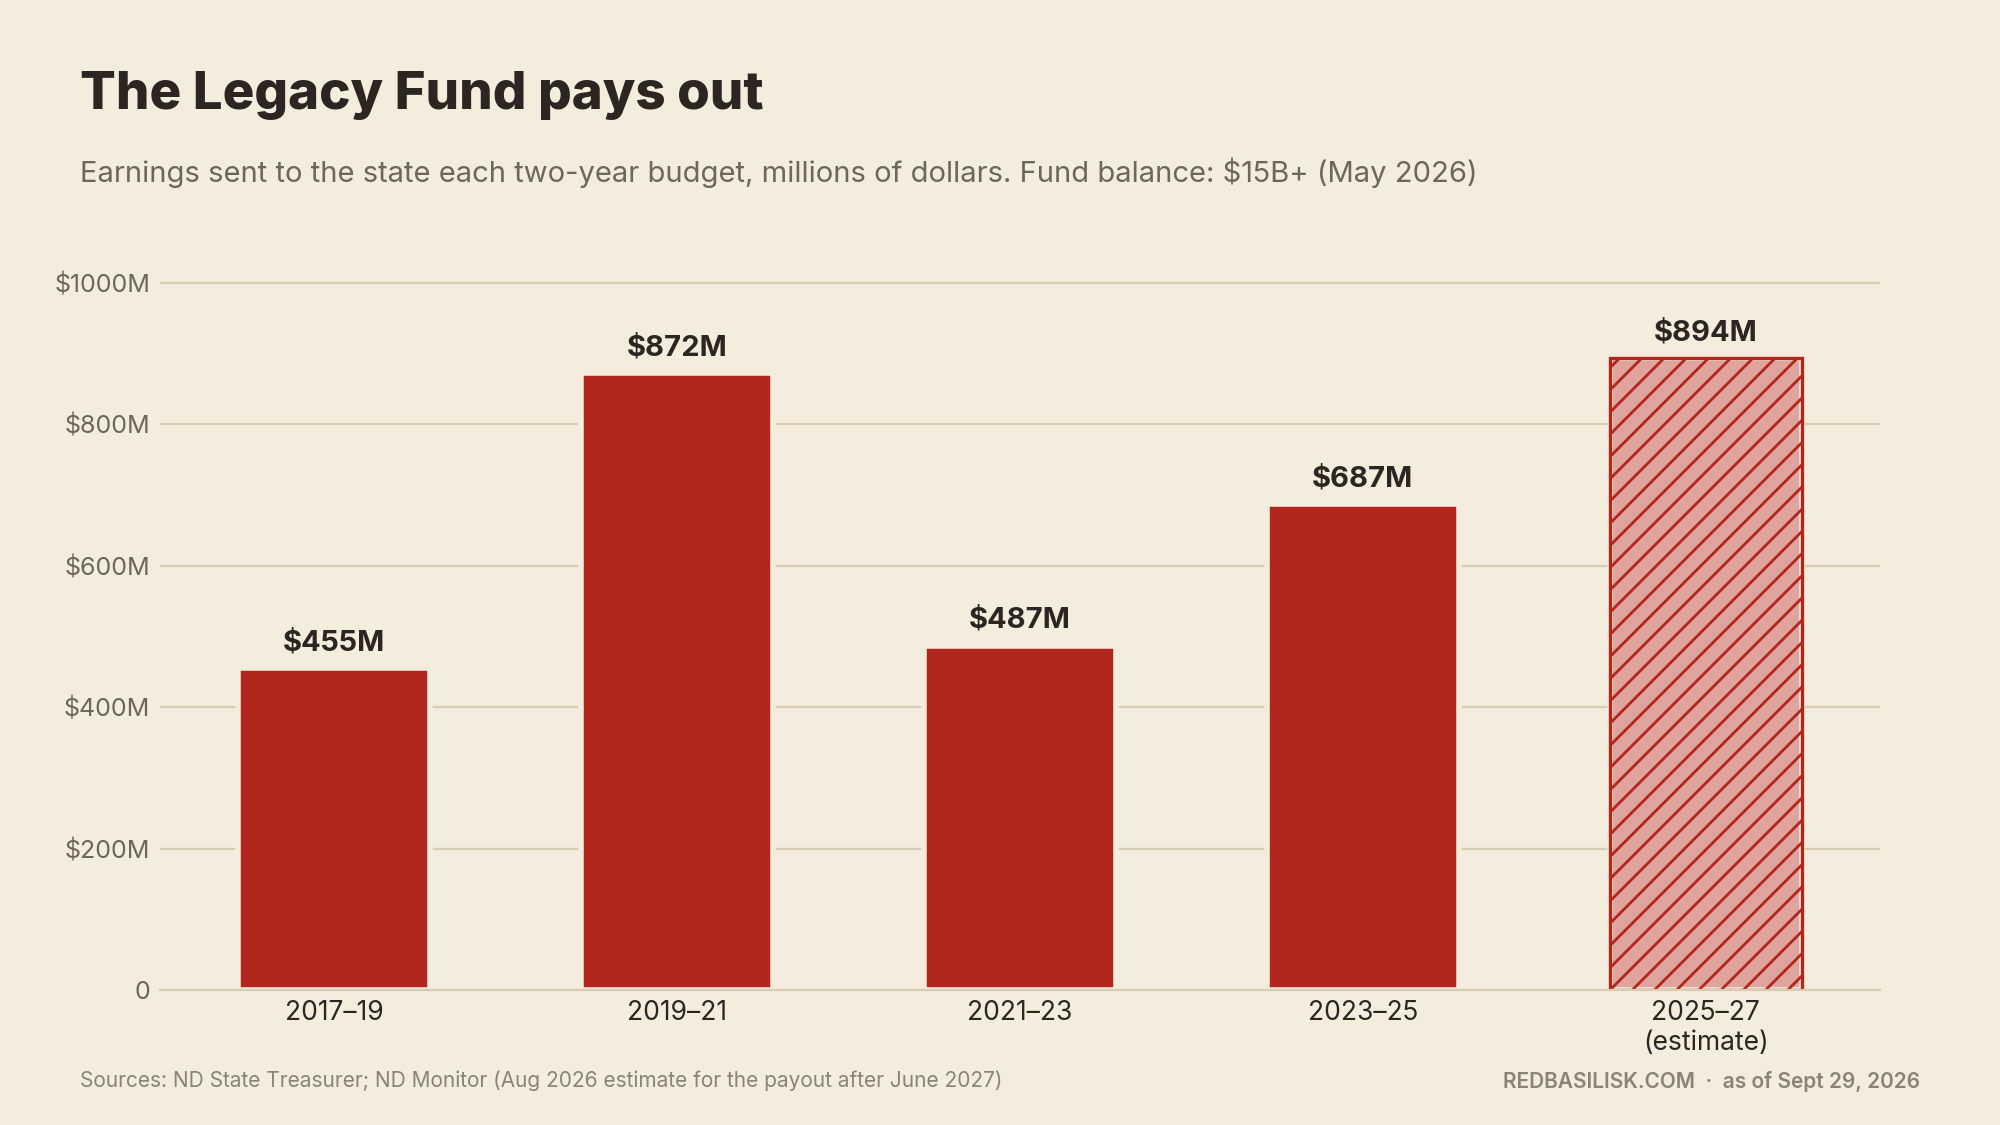
The principal is meant to stay put. The earnings get spent. Since 2019 the fund has sent between roughly $450 million and $870 million to the state every two years. The two most recent payouts went mainly to tax relief, bond payments and roads, and the next one is estimated at about $894 million.
How the counties got paid: the flip
Here's the part most people feel but can't quite explain.
Oil wells don't pay regular property tax. Instead, the state charges a 5 percent gross production tax on the value of the oil, and state law treats that tax as a stand-in for property tax. That one tax is where much of the oil counties' local money comes from.
The formula for splitting it has changed a lot. In 2007, right as the boom began, a producing county kept all of its first $1 million, then 75 percent of the second million, 50 percent of the third, and only 25 percent of anything past $3 million. The more oil a county produced, the smaller the share it kept.
That worked fine when a big county made a few million a year. It did not work when counties started generating hundreds of millions while their roads, jails and schools were overwhelmed.
The legislature raised local shares in 2009 and kept adjusting from there. Under the current formula, a producing county keeps all of its first $5 million, which it then splits with its cities, schools and townships. Past that, the local side keeps 30 percent and the state takes 70. Out of the state's side, fixed pools go to the three "hub cities." In fiscal 2026, Williston got about 56 percent of that hub money, Dickinson 31 percent and Minot 13.
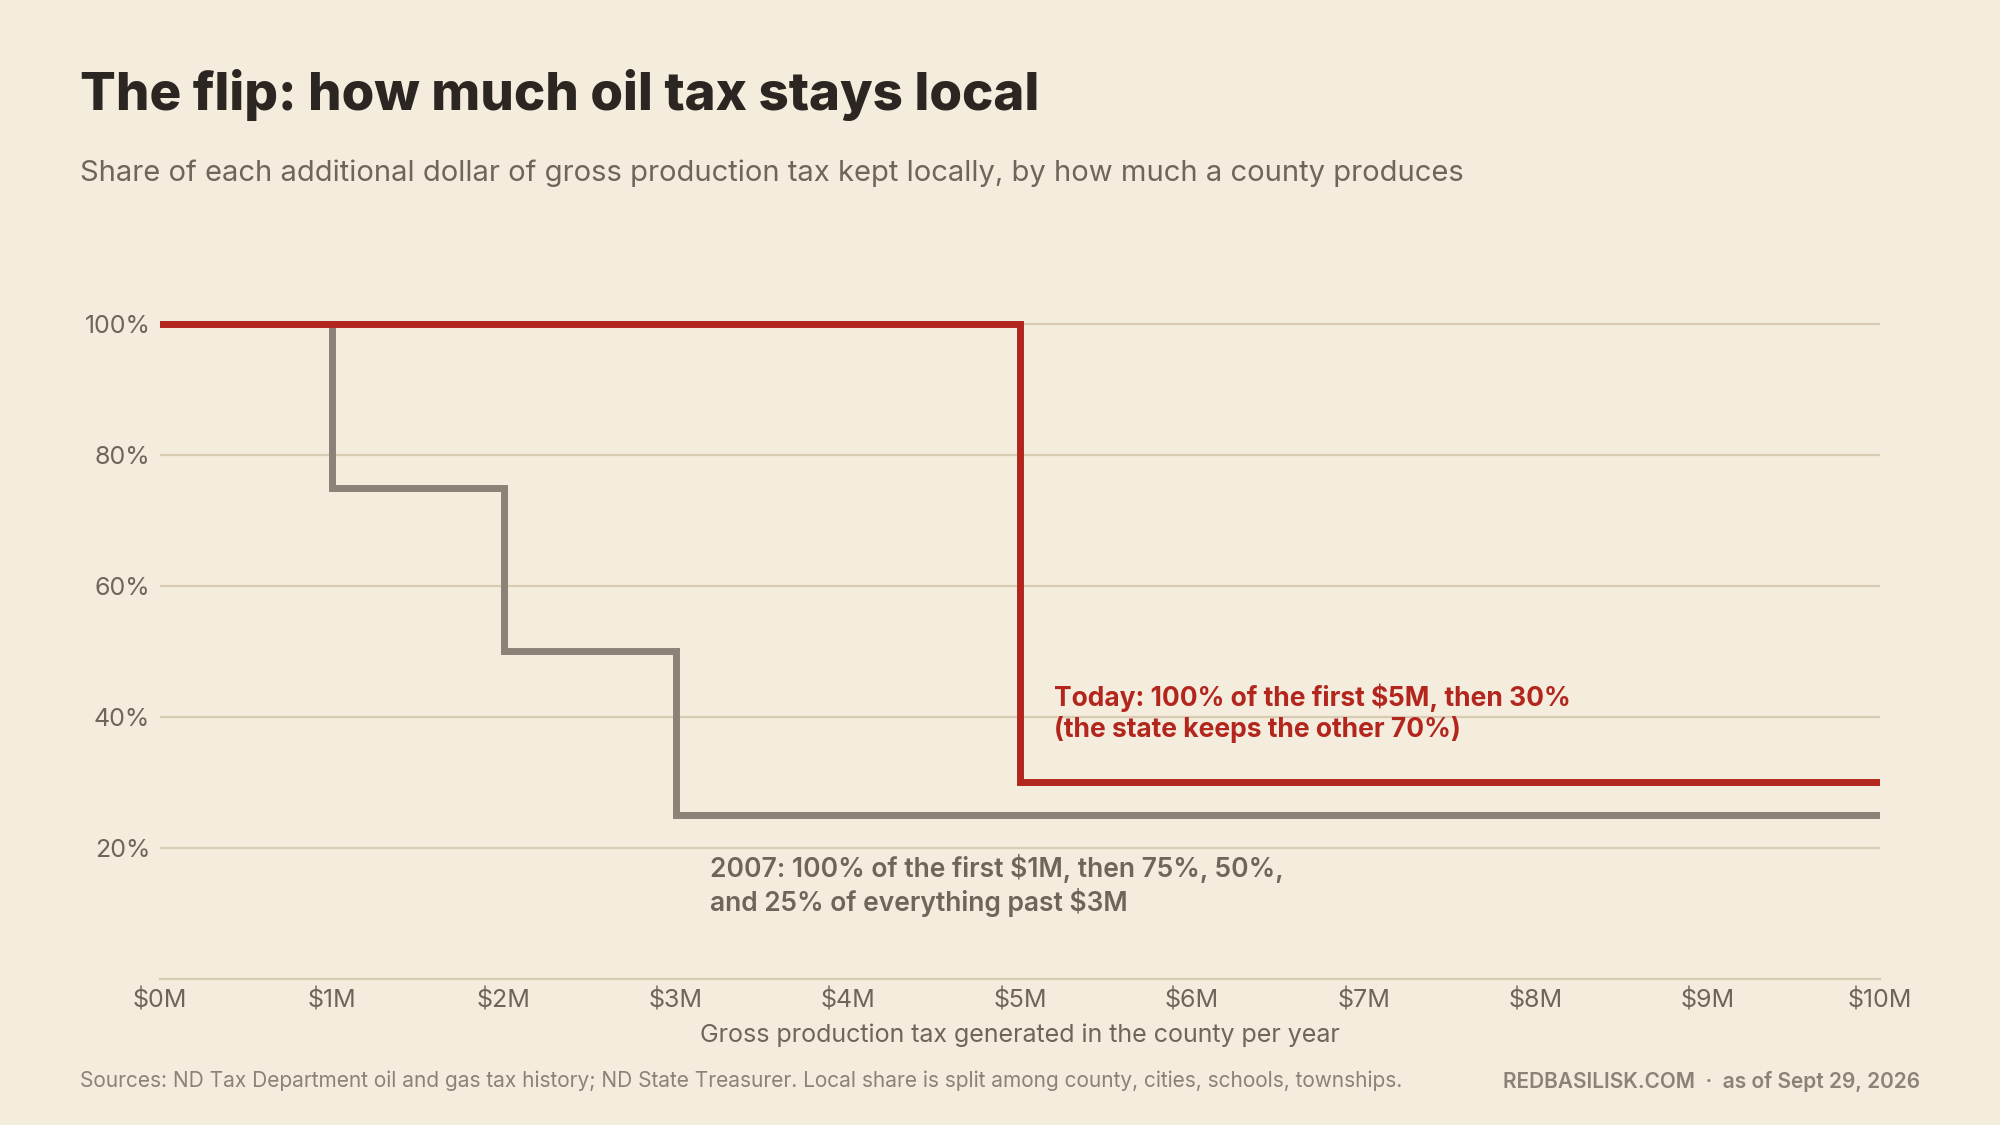
So the flip is real. Oil counties went from leaning on local property tax to leaning heavily on a state-run oil formula. A county's budget now rises and falls with the price of oil and whatever the legislature decides to change every other winter.
Where it got spent, and why people are still sore
Nothing makes people madder than seeing oil money turn into buildings they didn't ask for.
The big Capitol-grounds project of the boom years was the North Dakota Heritage Center in Bismarck. In 2009 the legislature authorized a $51.7 million expansion, with about $40 million in state money. It opened in 2014 and nearly doubled the building. The museum had to raise the rest, and more than half of that private share came from energy companies. Another expansion, a military gallery, is due in 2027.
Out in the patch, local governments built too. Divide County put a 26,000-square-foot, three-story addition onto its hundred-year-old courthouse in 2017 to house law enforcement, social services and health services. Towns across the region built or rebuilt arenas, community centers and city shops.
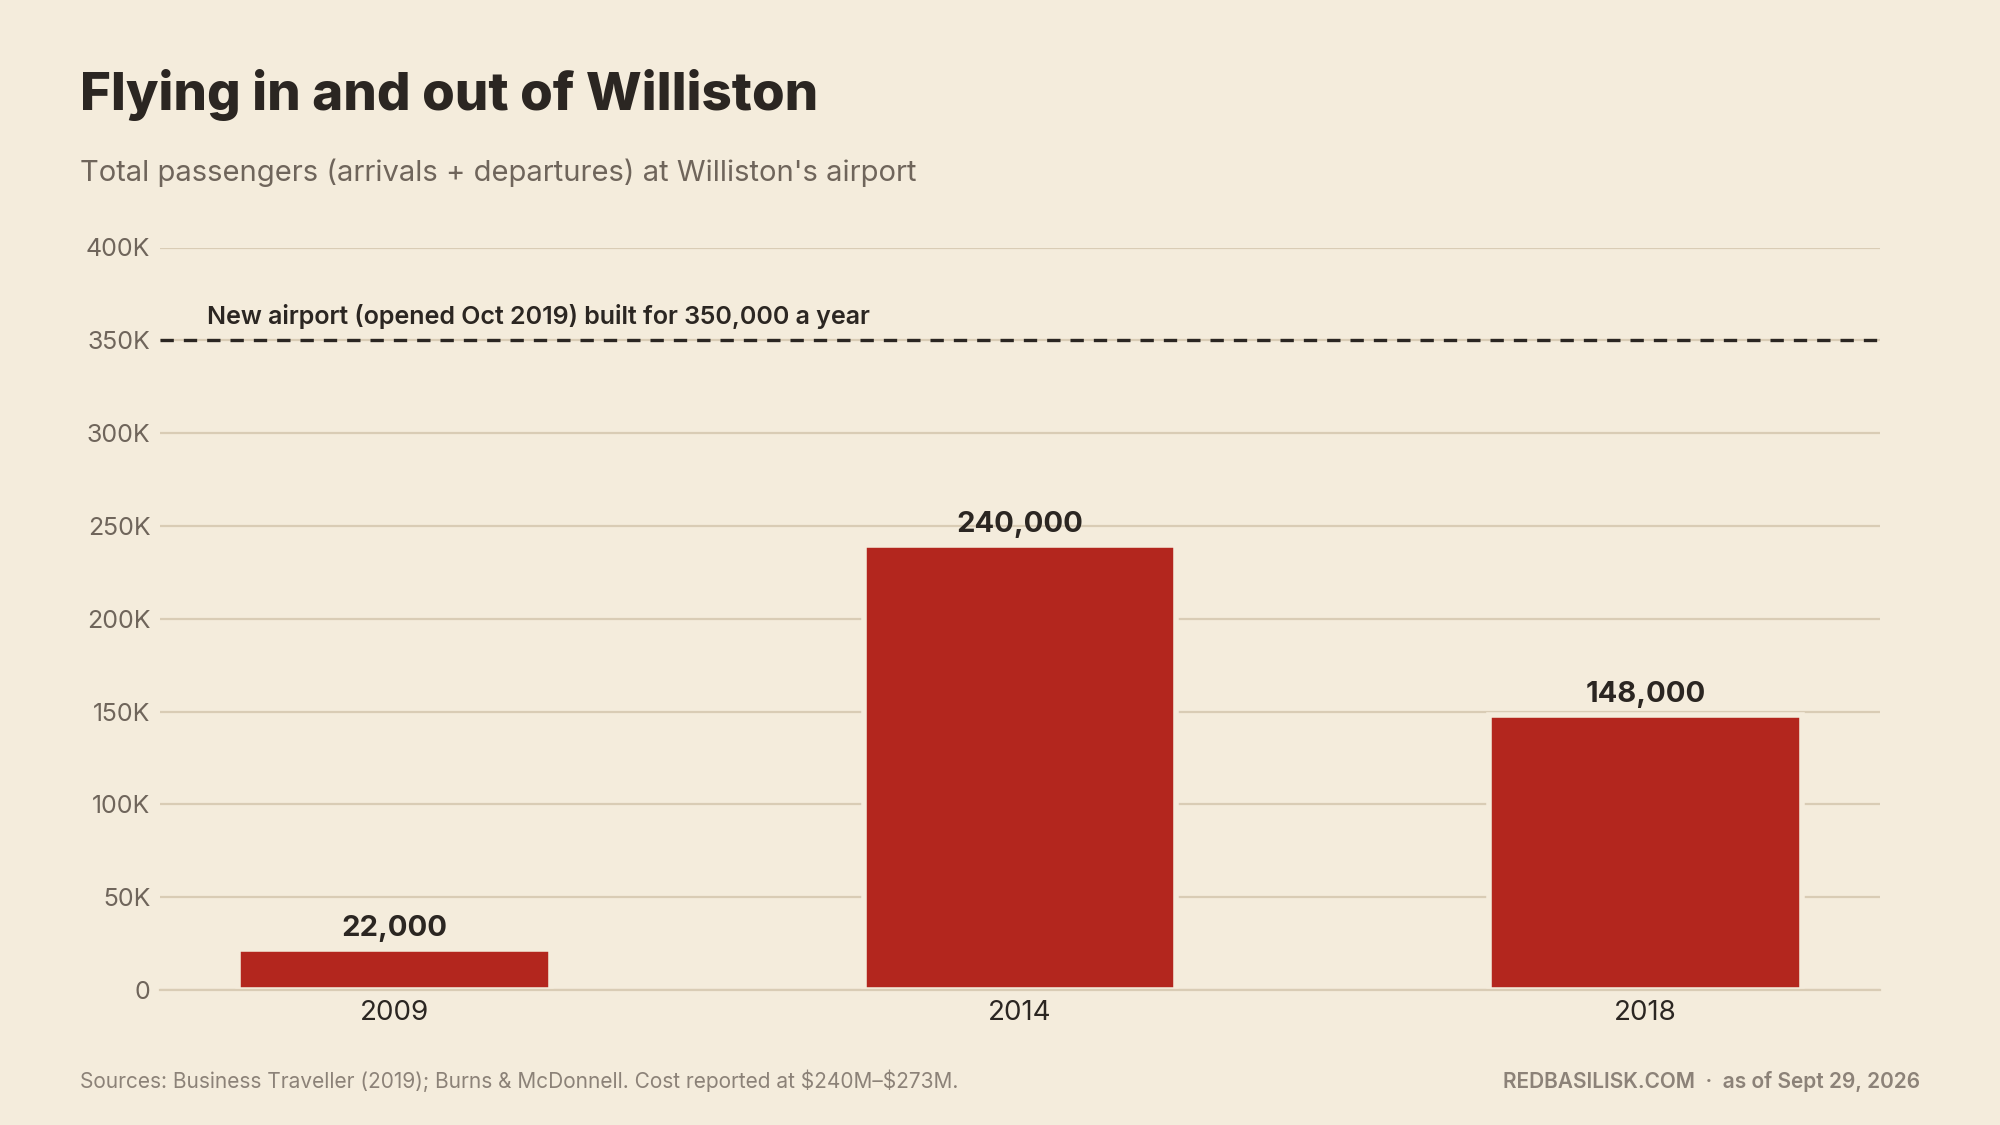
The biggest single local project was Williston's new airport. It replaced a field whose sloped, short runway couldn't take bigger jets. The price was reported at $240 million to $273 million, split among the FAA, the state and the city, and it opened in October 2019.
The passenger numbers explain why. About 22,000 passengers flew in or out of Williston in 2009. By 2014 it was 240,000. By 2018, after the bust, it was 148,000. The new airport was built to handle 350,000 a year.
There are two honest ways to read all this.
Critics say the state sat on billions while the west choked. Money went to Bismarck landmarks, rainy-day funds and property tax relief across the whole state, while oil counties waited years for the roads and schools they needed right then. And when local projects did get built, they didn't always serve the people who were promised them.
Defenders point out that the state did move serious money west. In 2015, as prices fell, the legislature passed a $1.1 billion "surge" bill aimed mostly at oil-impact and road needs, including $450 million for state highways. For the 2013 to 2015 budget, a key senator's breakdown showed $586 million going back to oil-field cities and counties, $682 million to infrastructure, and $342 million to property tax relief. And the Legacy Fund means a big share of the windfall was saved instead of spent.
Both of those can be true at once. The money was real, and so was the lag.
The people: who came, and who stayed
North Dakota grew from about 639,000 people in 2003 to a record 799,358 in 2025, and the state thinks it has since passed 800,000.
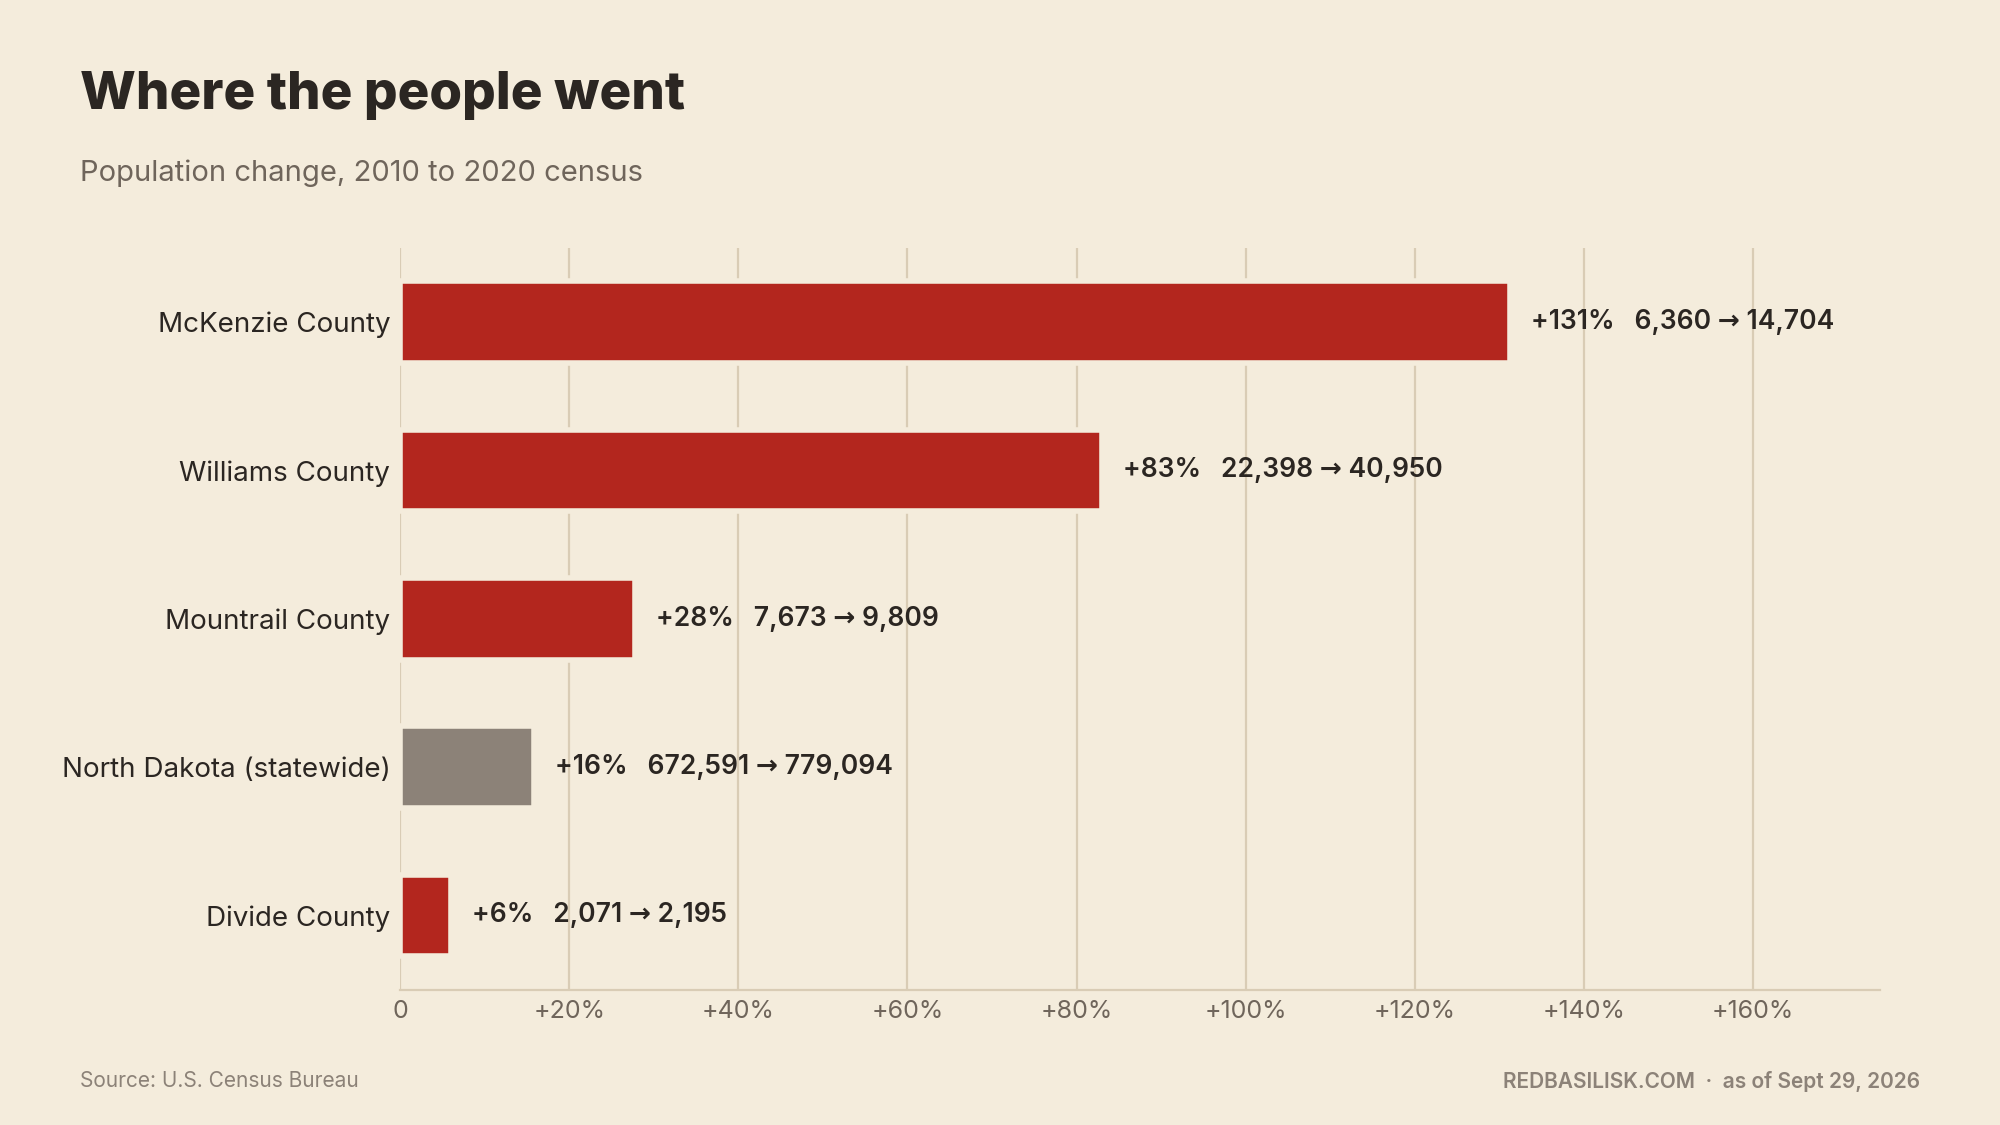
Most of the growth landed in a few counties. Between 2010 and 2020, McKenzie County grew 131 percent, from 6,360 to 14,704, the fastest growth of any county in the country. Williams County grew 83 percent. Williston roughly doubled, from about 14,700 people to about 29,000.
Not every county rode the same wave. Mountrail grew about 28 percent. Divide County, up on the rim of the Bakken where the oil is thinner, grew about 6 percent, from 2,071 to 2,195. Its population is estimated to have slipped back to about 2,100 since.
The new people were different, too. Williams County's median age is now about 32. Divide County's is about 50. Williams County is now roughly 10 to 12 percent Hispanic and 5 to 6 percent Black, up from about 2 percent and under 1 percent in 2010.
For a while, a lot of them lived in camps. Williams County approved about 9,600 temporary housing beds. One lodge near Tioga held 1,200 beds and planned for 2,500. In 2011, the New York Times reported that about a third of Mountrail County's population was living in temporary housing. Many of those camps have since closed.
Wages and rent: everybody got a raise, and everybody paid for it
The raise wasn't only for oil workers. That's the part that hit farms hardest.
Between 2004 and 2011, the average wage in the oil counties rose more than 80 percent after inflation, to about $56,000. Economists at the Minneapolis Fed found that about three-quarters of that increase came from pay rising across industries. Only about a quarter came from people moving into oil work. Oil jobs went from 12 percent of employment in the core counties to 41 percent.
Federal labor data tell the same story from 2007 to 2011. Average pay in the Bakken region of North Dakota and Montana rose 53 percent, from about $33,000 to $50,600. Nationally, pay rose 8 percent and employment fell. Williams County added more than 12,500 jobs, more than doubling. Even Divide County's employment was up 31 percent.
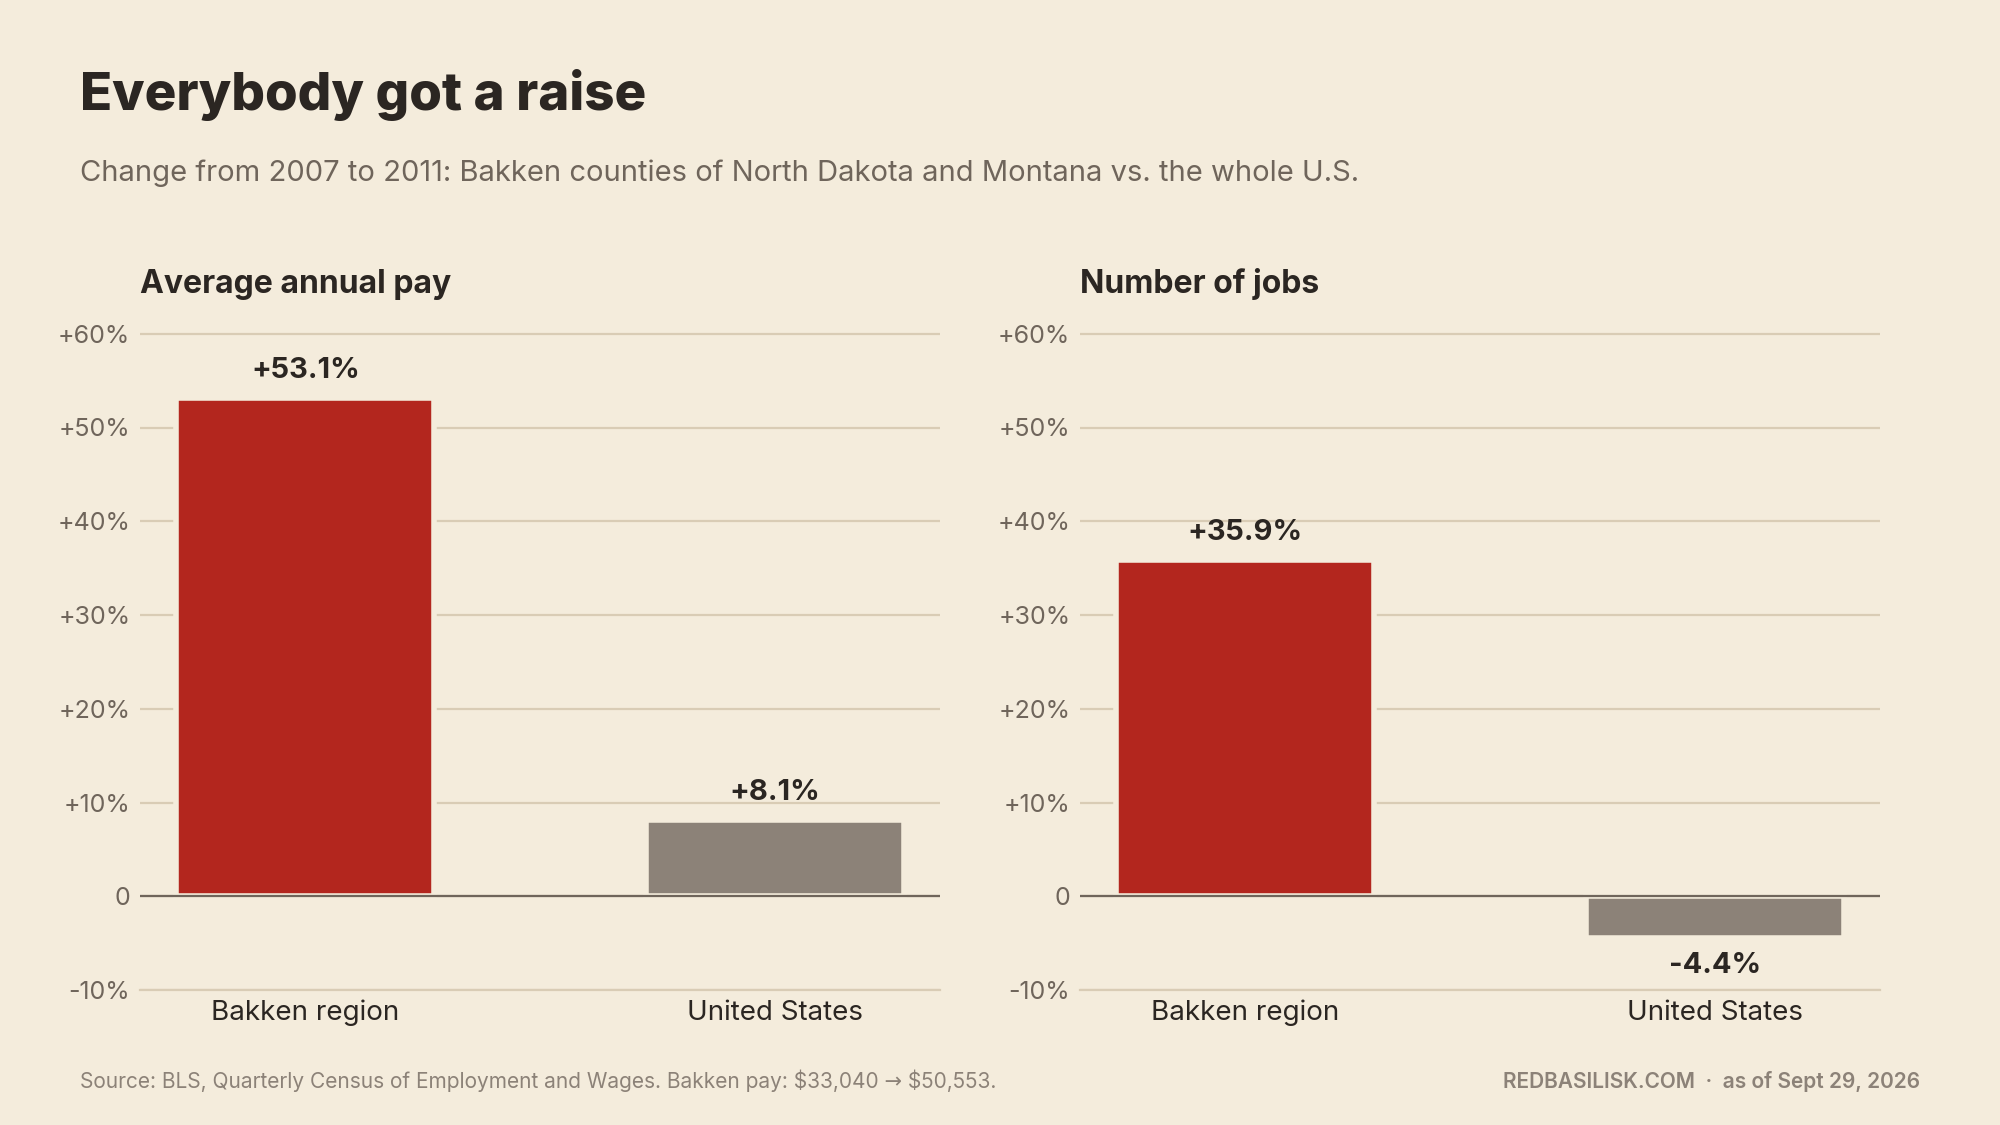
When the gas station, the school and the county shop all have to match oilfield pay, a farm or ranch has to as well, or it goes without help.
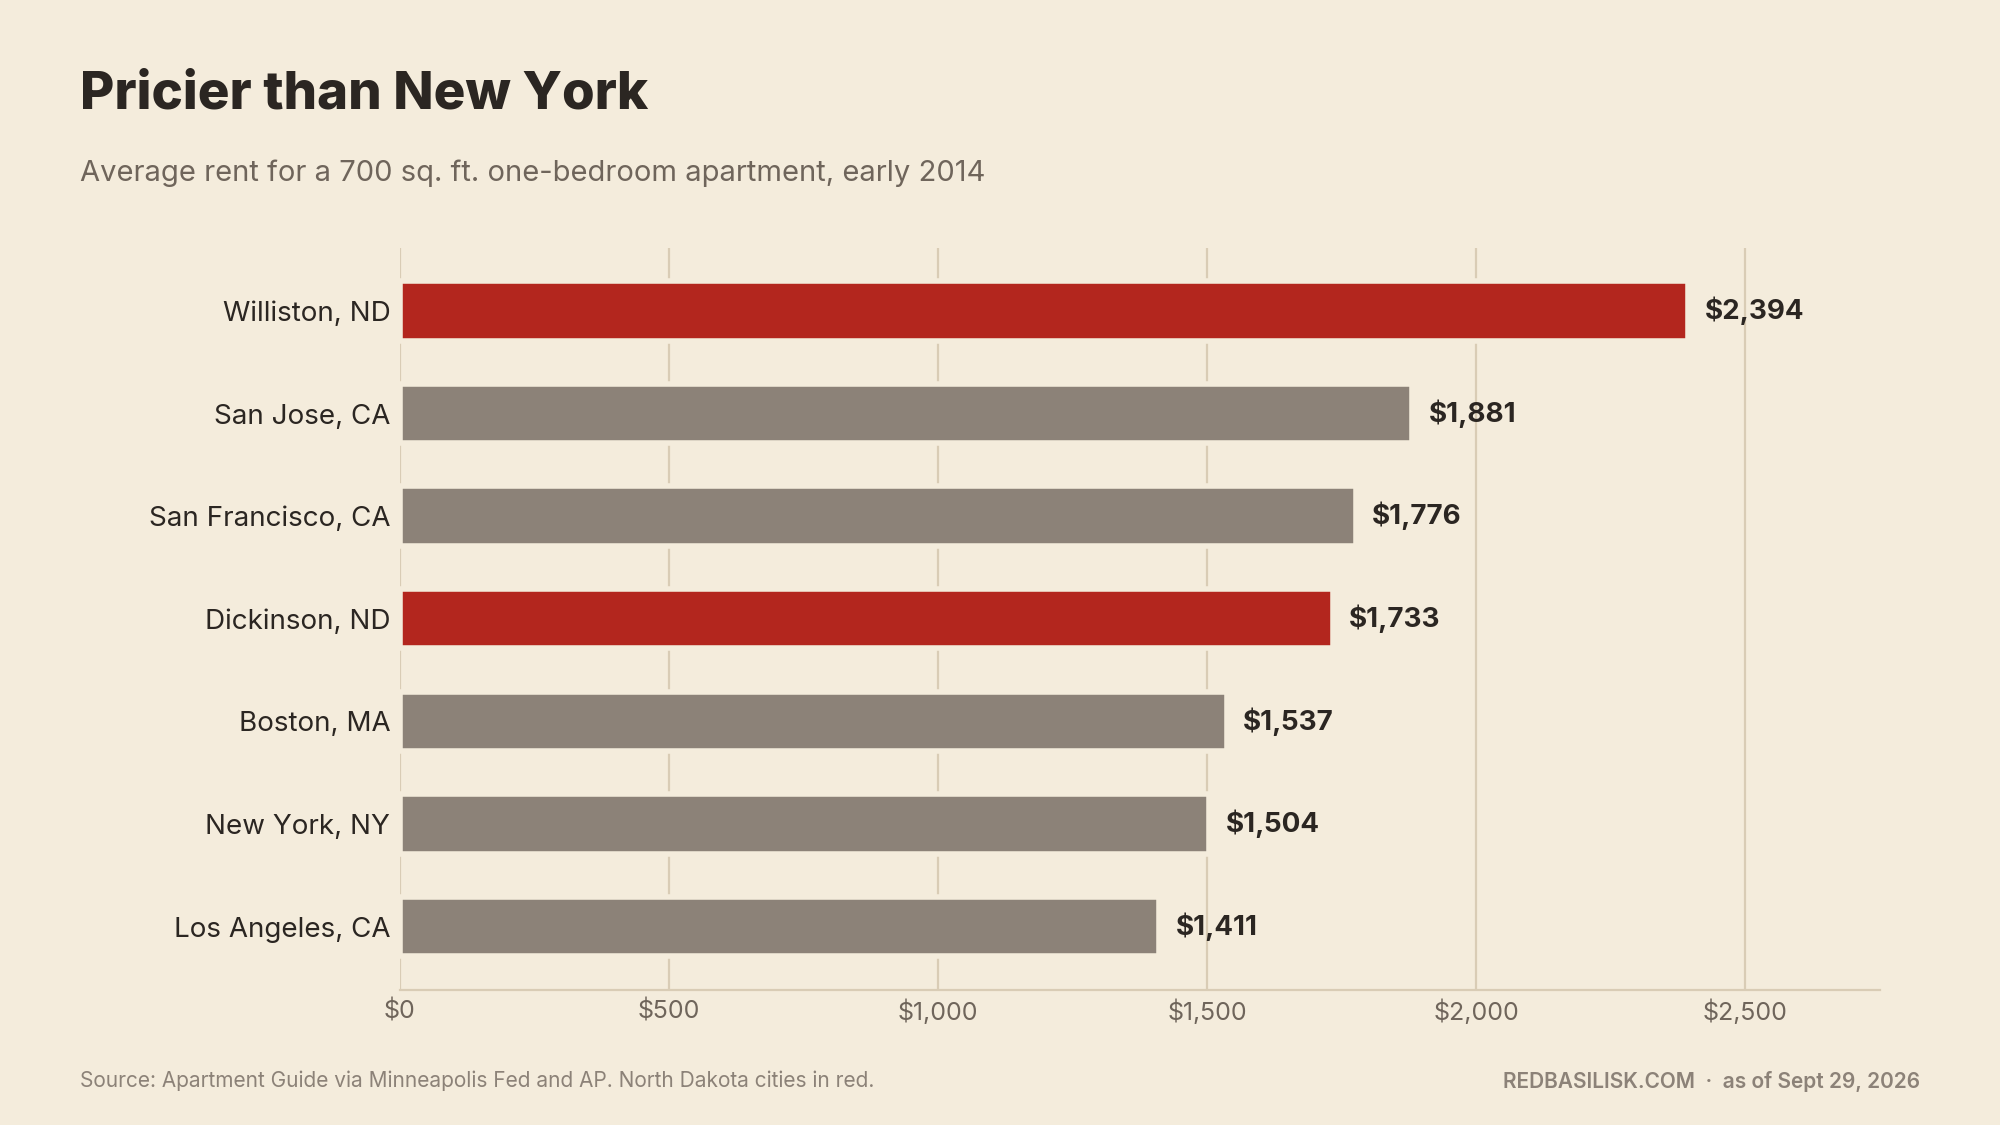
Housing was worse. In early 2014, Apartment Guide found that a small one-bedroom in Williston averaged $2,394 a month. That was the highest in the country, more than San Jose, San Francisco or New York. Dickinson was fourth.
The people who got hurt most were the ones who didn't get the oilfield raise. One Williston senior's $700 apartment was set to nearly triple, and she moved 230 miles to Bismarck to be near her daughter. Others left behind the friends and churches of a lifetime. During the boom, one Williston mobile home park raised lot rent from $375 to $800.
Schools are still catching up. In 2014, Williston voters approved $34 million for a new high school. Then no school bond passed for ten years, even as the district ran past capacity for most grades. In 2024 voters finally approved $35 million toward a 600-student elementary school. Sloulin Elementary opened its doors this August.
Freight: when ag had to get in line
Before there were enough pipelines, oil moved by train.
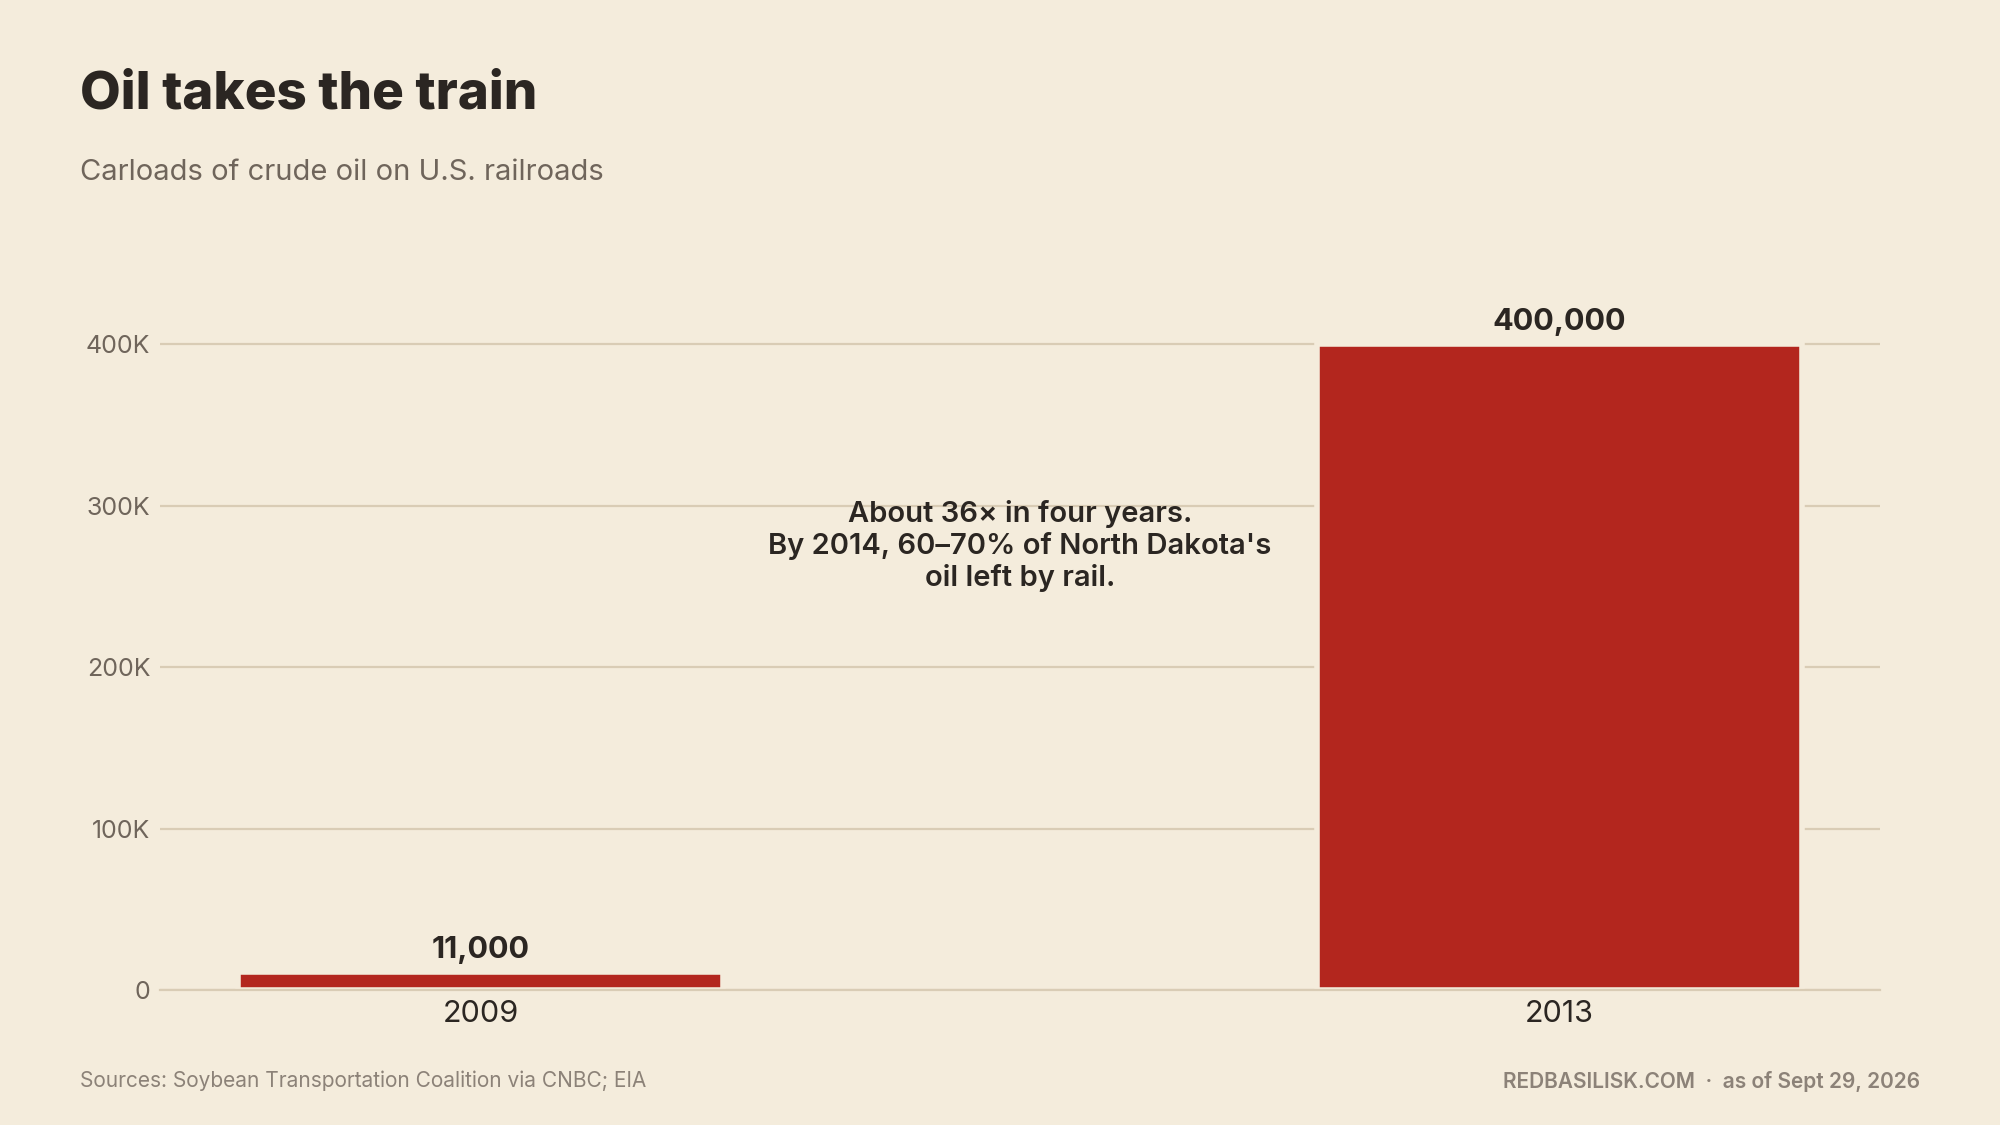
In 2009, U.S. railroads hauled about 11,000 carloads of crude oil. By 2013 they hauled about 400,000. By 2014, roughly 60 to 70 percent of North Dakota's oil was going out by rail.
The winter of 2013 to 2014 was brutal, the grain crop was big, and the tracks were packed. In the spring of 2014, federal regulators held a hearing on the grain backlog and later ordered BNSF and Canadian Pacific to file plans to fix it. In September, BNSF reported 2,231 grain cars running past due. A University of Minnesota study put Minnesota farmers' losses from March to May 2014 alone at about $100 million, and NDSU documented similar losses in North Dakota.
The railroads said weather and congestion in Minneapolis and Chicago were the bigger problem, and that they were shipping more grain than the year before. Farmers standing next to full bins didn't find that very comforting.
The worst of it eased by the next winter, as the railroads added capacity and oil shipments fell along with prices. The longer-term fix was pipe. When the Dakota Access Pipeline came online in 2017, able to move about half of the state's oil, rail's share of Bakken crude dropped sharply. Every barrel in a pipeline is a barrel that isn't competing with wheat for a railcar.
Roads: the two-day gravel
If there's one complaint every farmer in the west shares, it's the roads.
The numbers back it up. From 2010 to 2014, traffic on state highways in the oil-impacted counties rose 71 percent, compared with 26 percent statewide. NDSU's transportation institute estimated in 2016 that county and township roads statewide needed $8.8 billion over 20 years. About 40 percent of that was in the oil counties, and about two-thirds of it was for unpaved roads. Its latest study, in 2024, raised the 20-year estimate to $12.35 billion.
On heavily used gravel roads, the time between re-graveling shrinks and the number of bladings per month goes up. Truck traffic doesn't just use a road. It grinds it down faster than a township can afford to rebuild it.
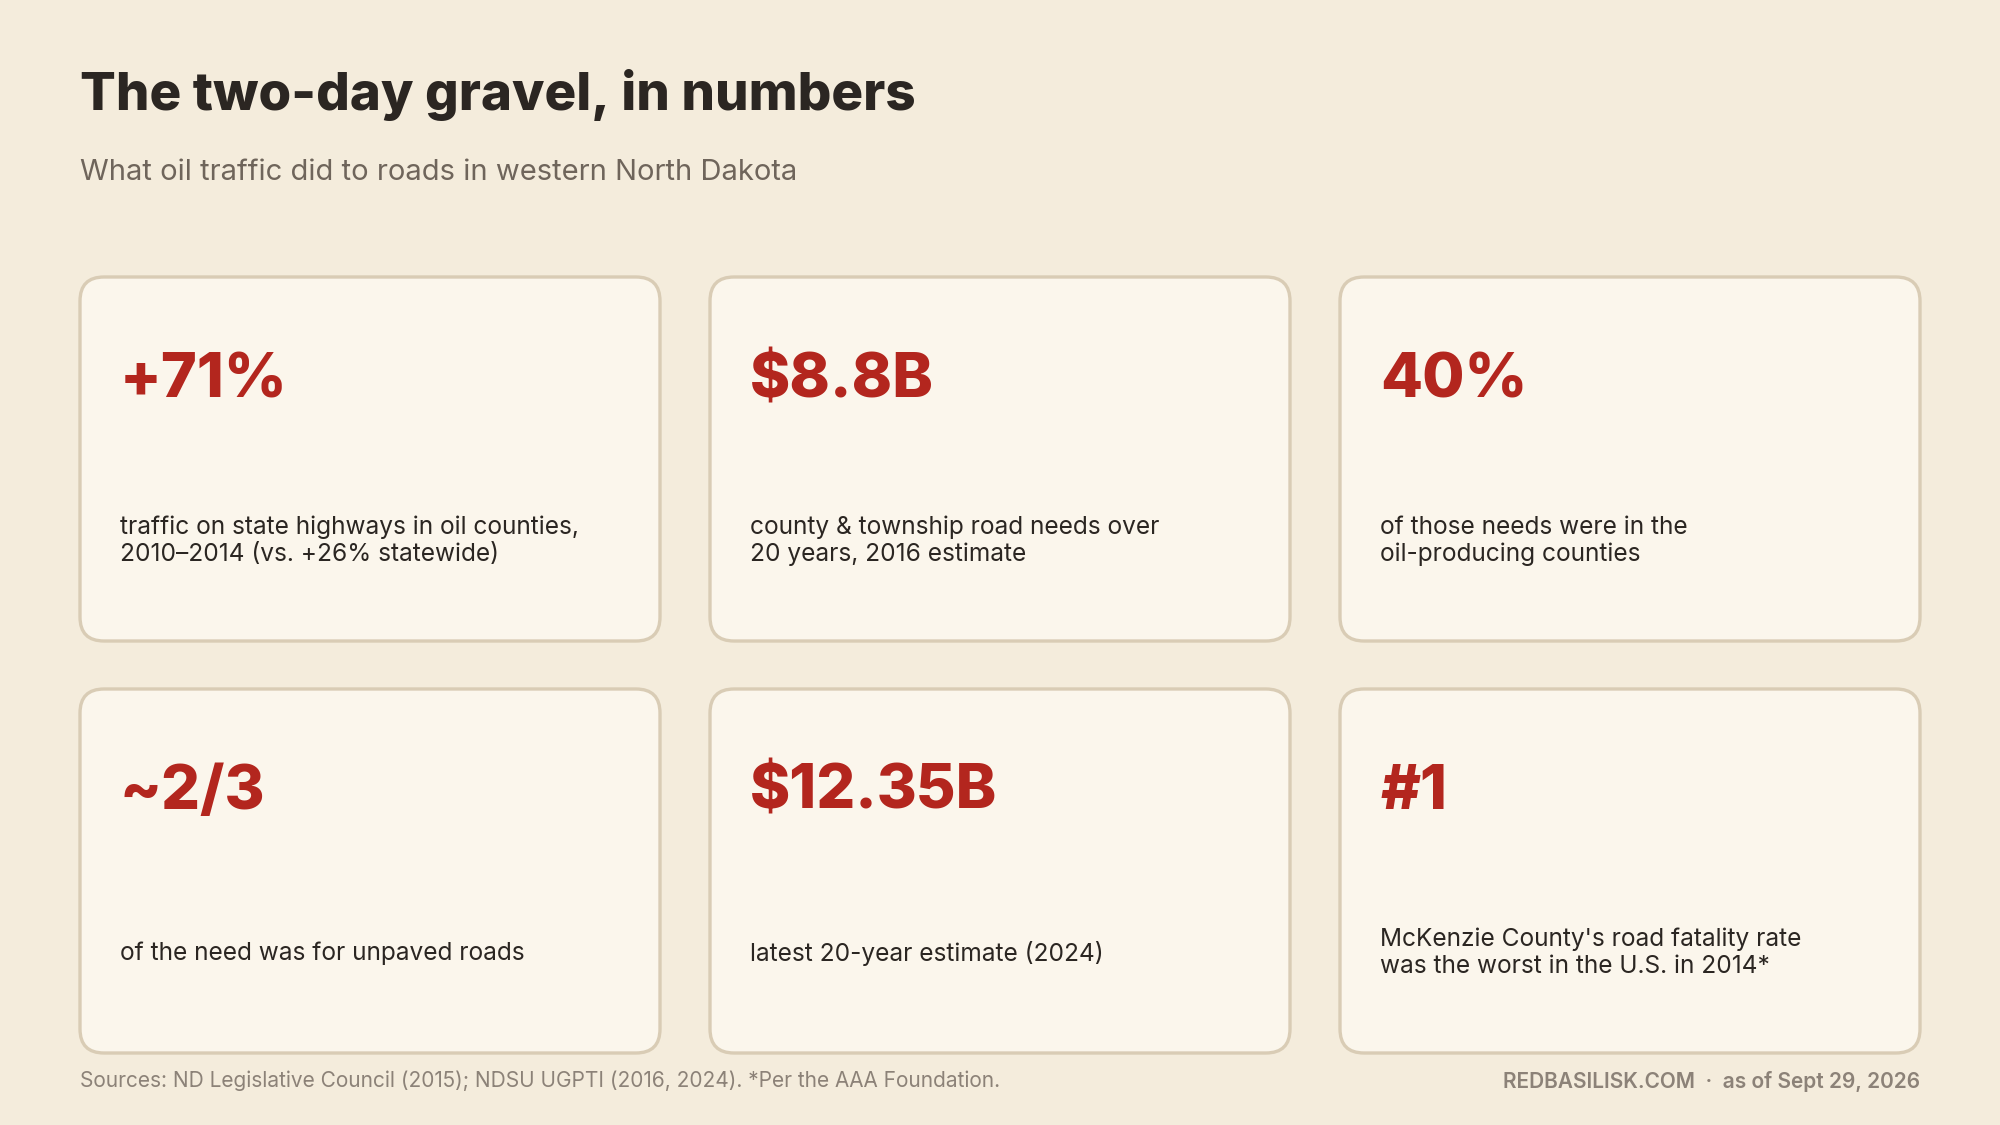
The cost wasn't only in dollars. North Dakota's traffic death rate jumped in 2009 as oil traffic rose. According to the AAA Foundation, McKenzie County had the worst road fatality rate in the nation in 2014. Between 2015 and 2019, McKenzie and two neighboring oil counties accounted for 42 percent of the state's fatal and injury crashes involving trucks.
The costs you don't see on a tax statement
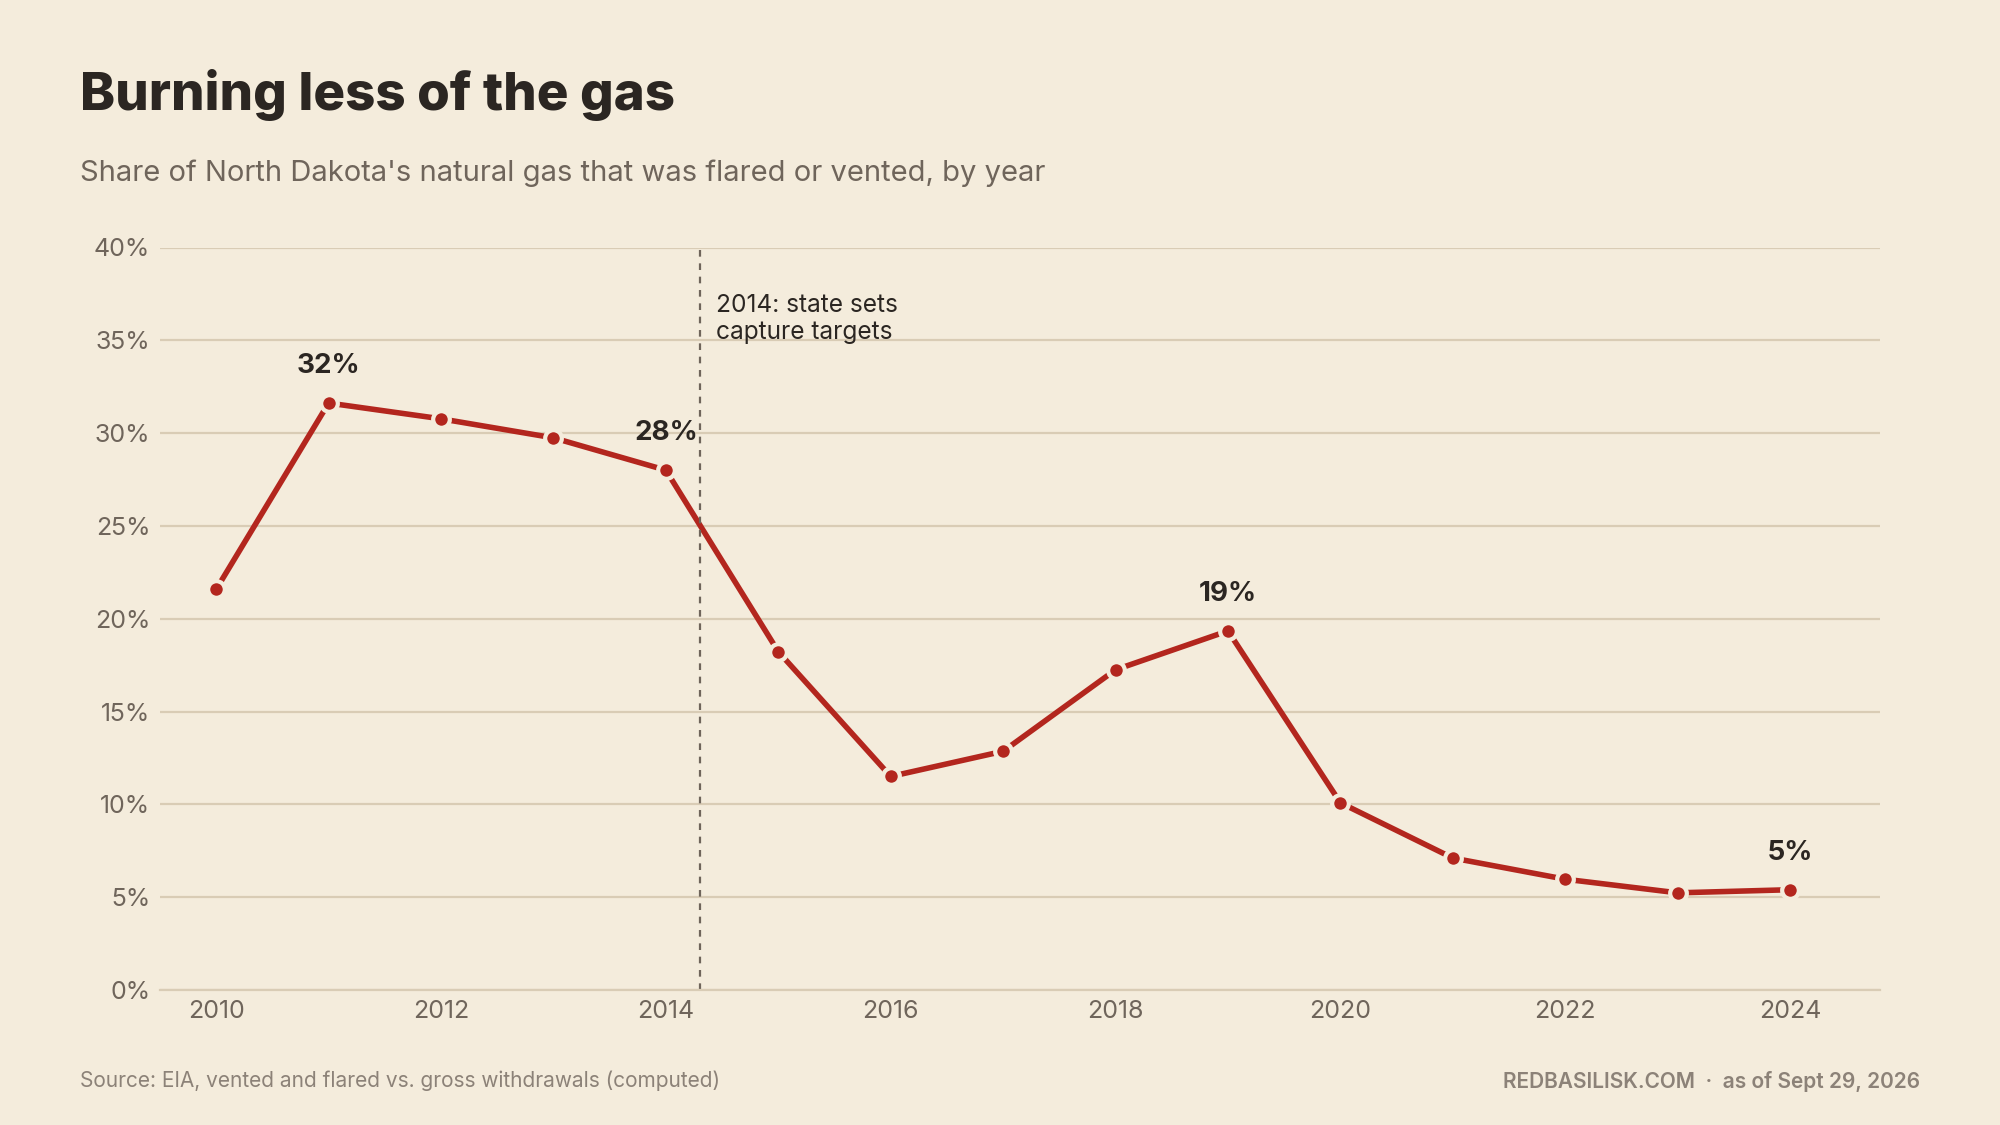
Flaring. For years, a lot of the natural gas that came up with the oil was simply burned off at the well because there was no pipe to take it. In early 2014, North Dakota was flaring about 36 percent of its gas, and about 28 percent for the year as a whole. That was close to half of everything flared or vented in the country. The state set capture targets that year.
It took a while. Flaring was still 19 percent in 2019 as production outran the pipes. But processing capacity grew from 1 billion cubic feet a day in 2013 to 4 billion by 2021, and by late 2022 the state was capturing about 95 percent of its gas.
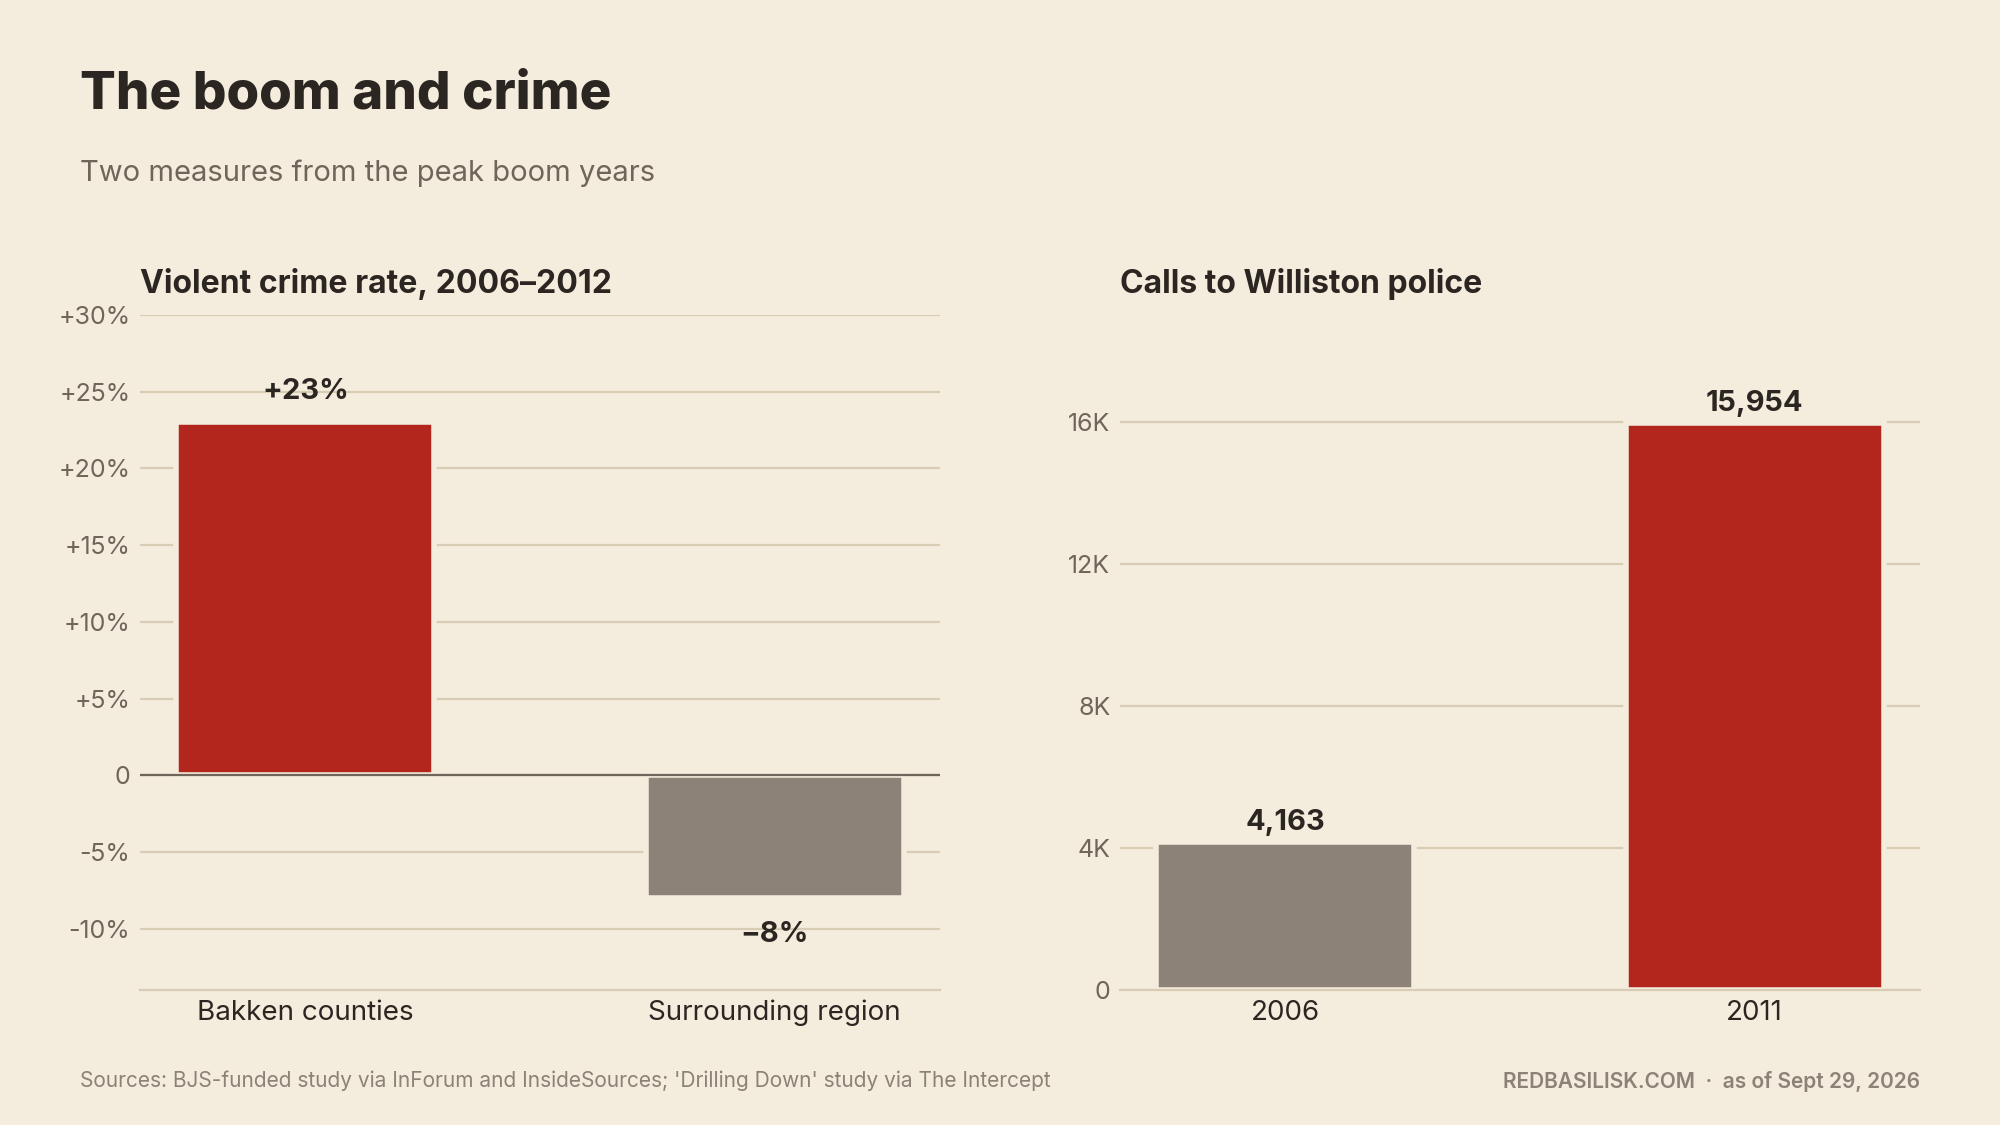
Crime. Between 2006 and 2012, the violent crime rate in Bakken counties rose about 23 percent, while it fell 8 percent in the surrounding region. Aggravated assaults went up 70 percent. In Williston, calls to police nearly quadrupled, from about 4,200 in 2006 to about 16,000 in 2011.
To be fair to the patch, the same study found the Bakken counties had started out safer than their neighbors, and by 2012 they were about even. The boom didn't make the west the Wild West. It took away a safety edge the region used to have.
Twenty years in, the scorecard
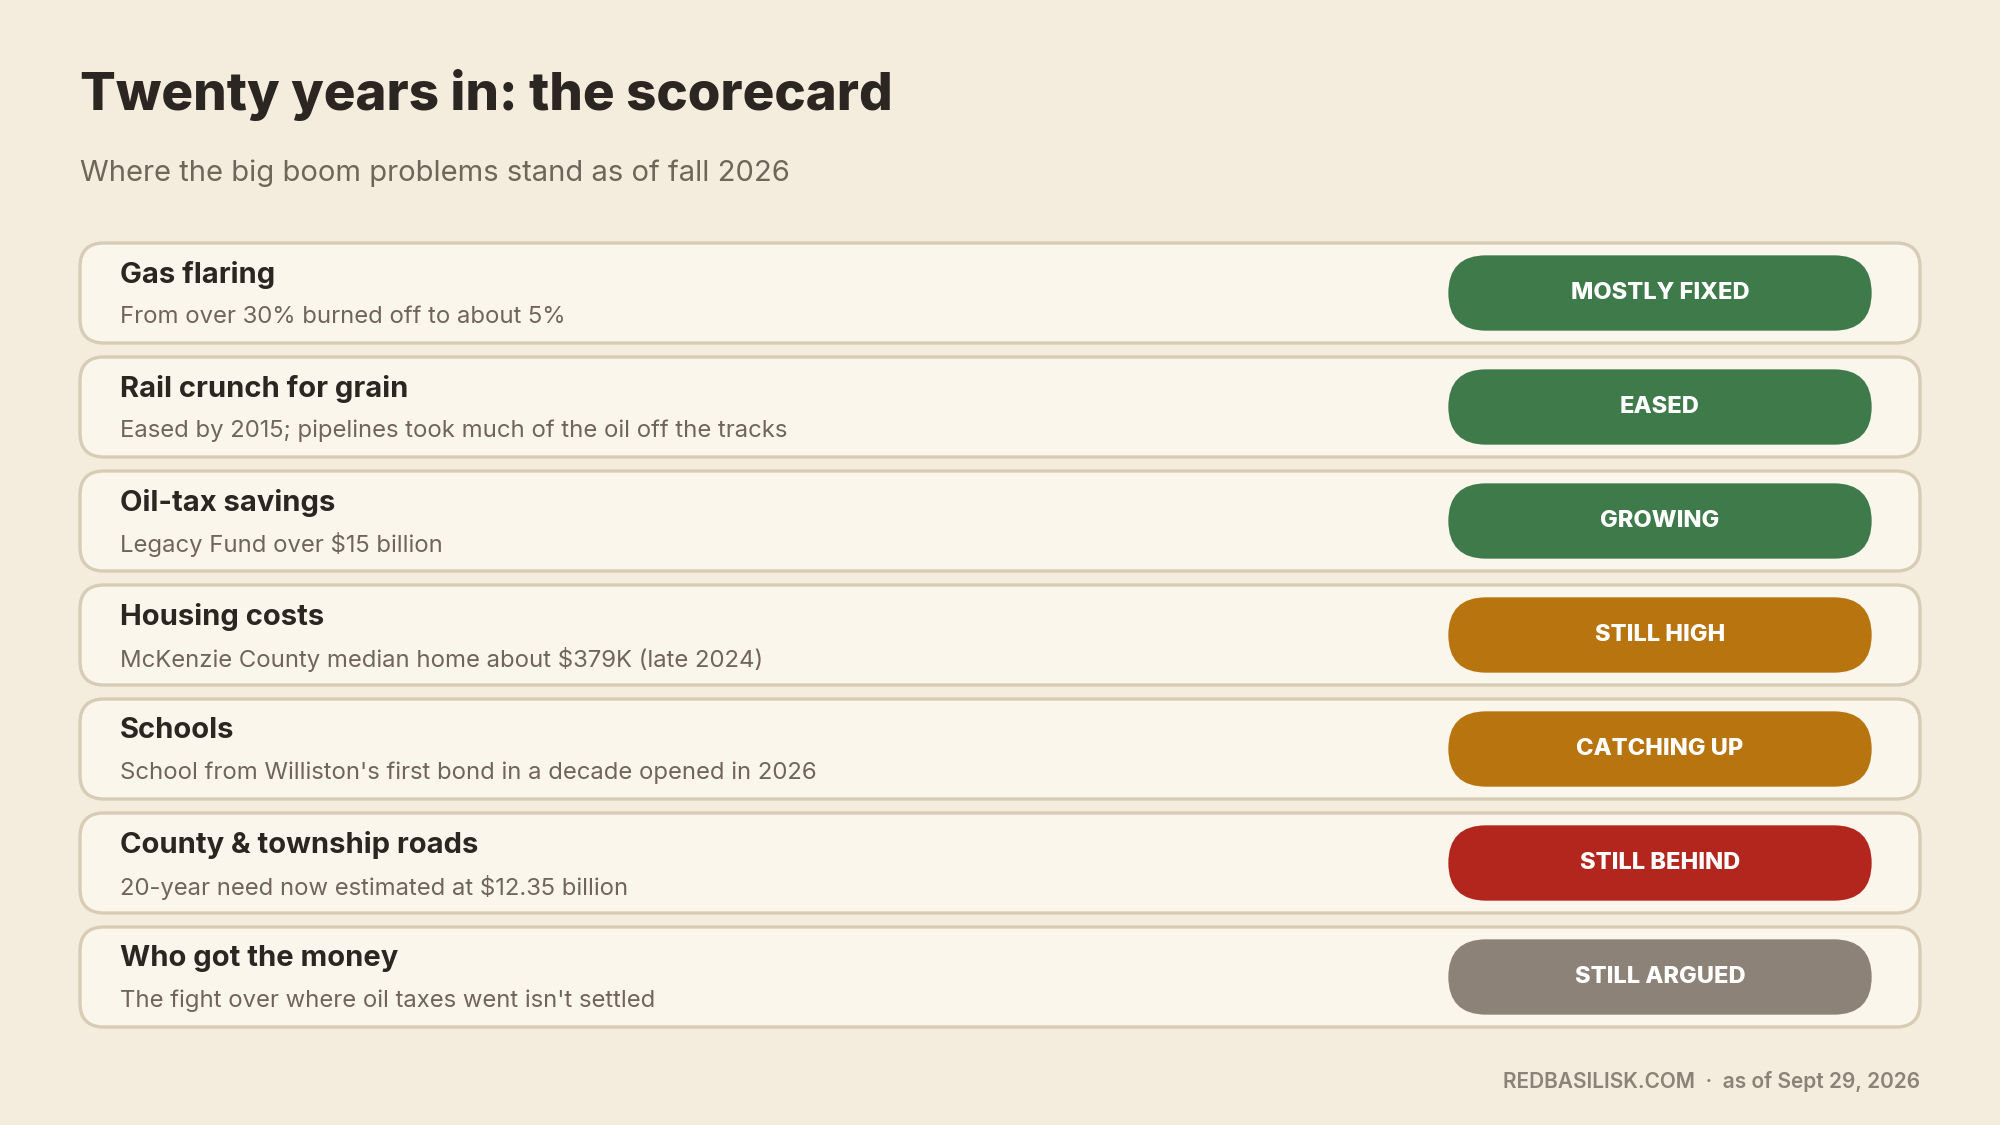
Put it all together, and here's where things stand.
Flaring is mostly fixed. The rail crunch eased, and pipelines have taken much of the oil off the tracks. The Legacy Fund is real money and still growing.
Housing is still expensive. By Realtors' figures, the median home in McKenzie County was worth about $379,000 in late 2024. Schools are still building to catch up with kids who arrived a decade ago. County and township roads are still behind, and that is not likely to change while the trucks keep rolling.
And the fight over who got the money, and what they built with it, isn't settled. It probably never will be.
My take
The last 20 years have made this part of the world unrecognizable. Some changes are good, others bad. The dirt road I rode my bike on as a kid is now constant semi traffic. It feels like half the safety and more than half the trust is gone. On the other hand, these communities are now thriving and productive, where they used to be ageing communities with ever decreasing numbers, there is now heavy competition for housing. The intention of this article isn't to complain nor celebrate, simply taking stock of what the last 20 years did to the Bakken.
How we dug into this
This piece started with a list of things people in western North Dakota complain about and the question of whether the numbers back them up. We researched it with AI tools, working from primary sources wherever we could find them: EIA production data, federal labor and crime statistics, the Census Bureau, the state Tax Department's own history of the oil tax formula, Legislative Council fiscal memos, the State Treasurer, NDSU's Upper Great Plains Transportation Institute, and the Minneapolis Fed.
Every chart was rebuilt from those numbers rather than copied from someone else's graphic. The production chart plots EIA's monthly figures, and the flaring chart divides EIA's yearly flared-and-vented volumes by total gas withdrawals.
A few limits are worth knowing. The per-person GDP rankings come from different analyses in different years, so treat them as a trend, not a precise series. The best crime study stops at 2012. The $32 billion tax total comes from a study by an oil industry foundation and the oil-county association, not from the state itself. And we couldn't find published price tags for every local project people argue about, so we left those out rather than guess.
As always, this article went through a separate AI fact-check pass before publishing.
Sources
- [EIA: North Dakota field production of crude oil (monthly)](
- [North Dakota oil boom (Wikipedia)](
- [Prairie Public: 200 Active Drilling Rigs](
- [UPI: North Dakota rig count low sets new record (May 2016)](
- [CNN: North Dakota's oil bust blows $1 billion hole in state budget](
- [Montana Economist: The Economic Impact of the Bakken](
- [North Dakota Monitor: Oil production resilient even as prices decline](
- [AEI: Shale oil turned North Dakota into the second most prosperous state](
- [Motley Fool: Oil, a rags-to-riches story](
- [USAFacts: North Dakota GDP](
- [The Flag: Latest oil and gas tax revenue study](
- [ND Petroleum Foundation: 2024 oil and gas tax revenue study](
- [KX News: ND oil and gas revenue generates $26 billion](
- [InForum: Legacy Fund crosses $10 billion](
- [ND Legislative Council: 2025-27 budget summary](
- [ND State Treasurer: Legacy Fund](
- [North Dakota Monitor: Legacy Fund earnings projected 30% higher next biennium](
- [ND Legislative Council: Legacy Fund earnings](
- [ND Tax Department: Oil and gas tax history](
- [ND State Treasurer: Oil and gas distribution flow chart, 2025-27](
- [ND Legislative Council: Gross production tax distributions, July 2026](
- [State Historical Society Foundation: Heritage Center expansion groundbreaking](
- [Center for Public Integrity: How oil and gas firms gained influence in North Dakota](
- [ND Legislative Council: Legislative office building study (Capitol grounds)](
- [Construction Engineers: Divide County Courthouse addition](
- [Williston Basin International Airport (Wikipedia)](
- [Business Traveller: New US airport to serve oil boom region](
- [Burns & McDonnell: Williston Basin International Airport opens](
- [Washington Times: North Dakota counters plunging oil prices with $1.1 billion surge](
- [ND Legislature: 2015 surge bill (SB 2103)](
- [Job Service North Dakota: Workforce review](
- [Governor of North Dakota: Record population estimate](
- [Williston, ND (Wikipedia)](
- [McKenzie County: Growth of North Dakota and McKenzie County](
- [Census Bureau: Four-fifths of metro areas grew, 2010-2020](
- [McKenzie County, ND (Wikipedia)](
- [Mountrail County, ND (Wikipedia)](
- [Divide County, ND (Wikipedia)](
- [Fox News/AP: Rent in North Dakota oil city exceeds New York](
- [Williams County demographics](
- [Census QuickFacts: Williams County](
- [Census Reporter: Divide County](
- [Census QuickFacts: McKenzie County](
- [Grand Forks Herald: The man camp controversy](
- [Bend Bulletin/NYT: North Dakota oil boom spawns man camps](
- [Minneapolis Fed: A rising oil tide lifts all wages](
- [BLS: Employment and wages in the Bakken shale region](
- [Minneapolis Fed: North Dakota oil boomtown has nation's highest rent](
- [NBC/AP: Oil boom raises rents in ND, pushes seniors out](
- [MPR News/AP: Oil boom raises rents, pushes seniors out](
- [Dickinson Press: A boom in rental rates](
- [KFYR: Williston's school bond passes](
- [Williston Herald: District 1 school bond](
- [KFYR: Williston school district enters crisis management mode (2019)](
- [KEYZ: Sloulin Elementary ribbon cutting](
- [CNBC: Are grain farmers losing out to oil for rail service?](
- [NPR: Oil industry blamed for freight rail delays](
- [EIA: Rail carries most North Dakota crude (2014)](
- [Senate Commerce Committee: Rail service and grain shippers (Sept. 2014)](
- [Daily Yonder: Farmers blame Bakken oil for rail delays](
- [Minneapolis Fed: Working on the railroad (2015)](
- [Inside Energy: Dakota Access Pipeline upends oil transport](
- [ND Legislative Council: Energy Development and Transmission Committee, July 2015 (traffic counts)](
- [NDSU UGPTI: Infrastructure needs, county, township and tribal roads (2016)](
- [ND Legislature: UGPTI 2024 road needs testimony (SB 2142)](
- [NHTSA: North Dakota Highway Safety Plan FY2018](
- [McKenzie County Farmer: North Dakota roadway deaths climb in 2026](
- [AAA Foundation: McKenzie County Safe System case study](
- [EIA: North Dakota flaring targets challenged by rapid production growth](
- [EIA: North Dakota flaring in 2014](
- [EIA: North Dakota natural gas vented and flared (annual)](
- [EIA: North Dakota flared 19% of its natural gas in 2019](
- [EIA: Bakken natural gas production and flaring, 2021](
- [The Center Square: North Dakota's gas capture rate](
- [Bureau of Justice Statistics: Violent victimization in the Bakken, 2006-2012](
- [InForum: Study shows just how violent Bakken became](
- [InsideSources: Did the Bakken boom turn North Dakota into the Wild West?](
- [The Intercept: Sexual violence and the Bakken oil boom](